
|Blockchain and Cryptocurrency Technical Analysis | Researcher | Macro View | NFA |


 As can be seen in the chart, the adventure that started after the major crash in November 2011 jumps above the moving average and reaches its peak at the end of 742 days in a parabolic fashion.
 When we use the trend basis fibonacci extension tool, we see that the movement has returned from the fibonacci 1.13 level with an increase of 135.55%. ++
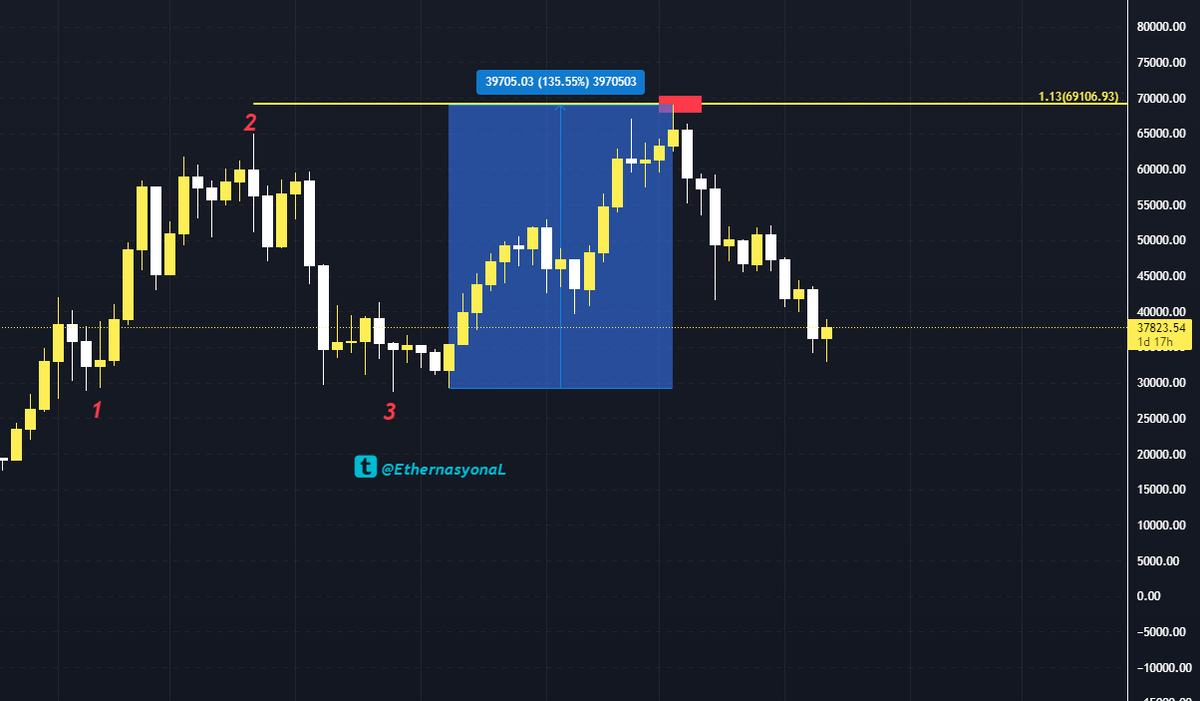
 In 2013, after the upper break of the channel middle band, only 3 retests were made and it increased by 2195%.