
Investor. Founder Longlead Capital Partners & author of The Inferential Investor. Ex Deputy Head at Regal Funds. PhD Finance. Not financial advice.
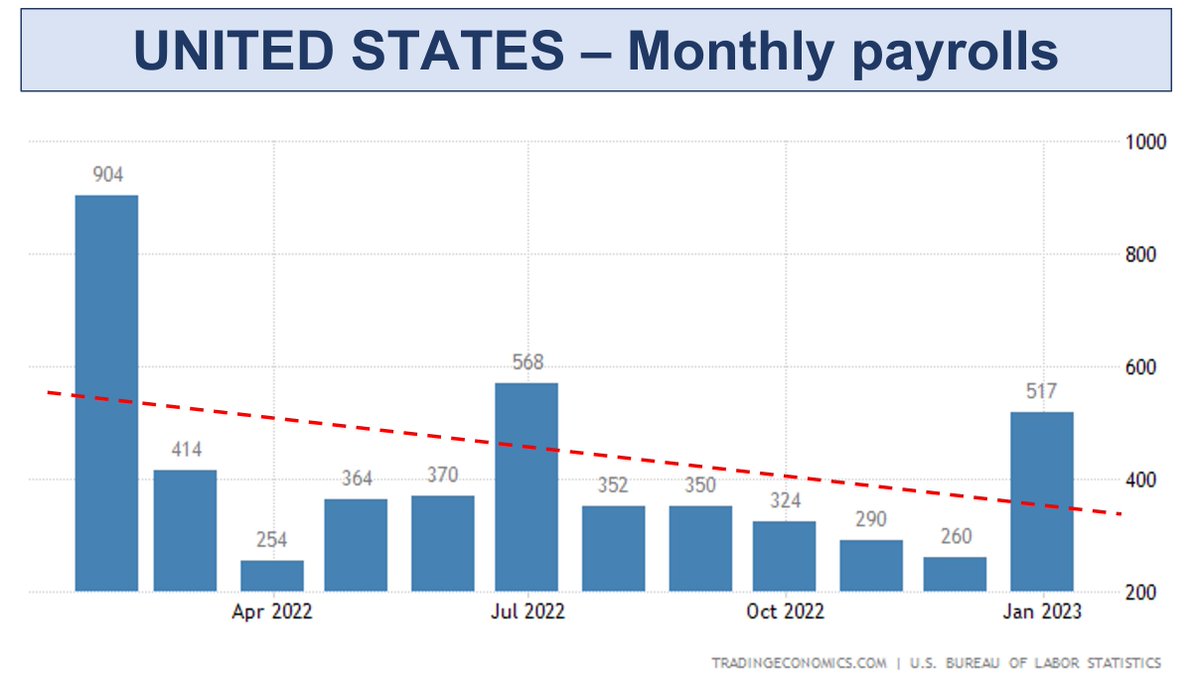
 2/ But less well understood is that under the payroll strength is both falling Hires and Separations.
 2/ On the back of this, we have flowed through a scenario of an AU rate pause to the HQ AUD model, with US rates still rising to 5.3%
 2/ Lets focus on whats happened, before future expectations
 2/ As always we present 2 scenarios. With variable lags to the impact of rate hikes, these models map out 2 assumption sets:
 2/ The chart shows that as inflation rose, the Nowcast underestimated it and as it falls, theres been overestimation. Why?
 2/8
2/8
 2/4 Whats this really showing?

 will fall (particularly in Q1), potentially to even ~5% by March data, but wage gains will see medium term services & core inflation drivers inconsistent in the Fed's lens with a sustainable return to 2-3% target.
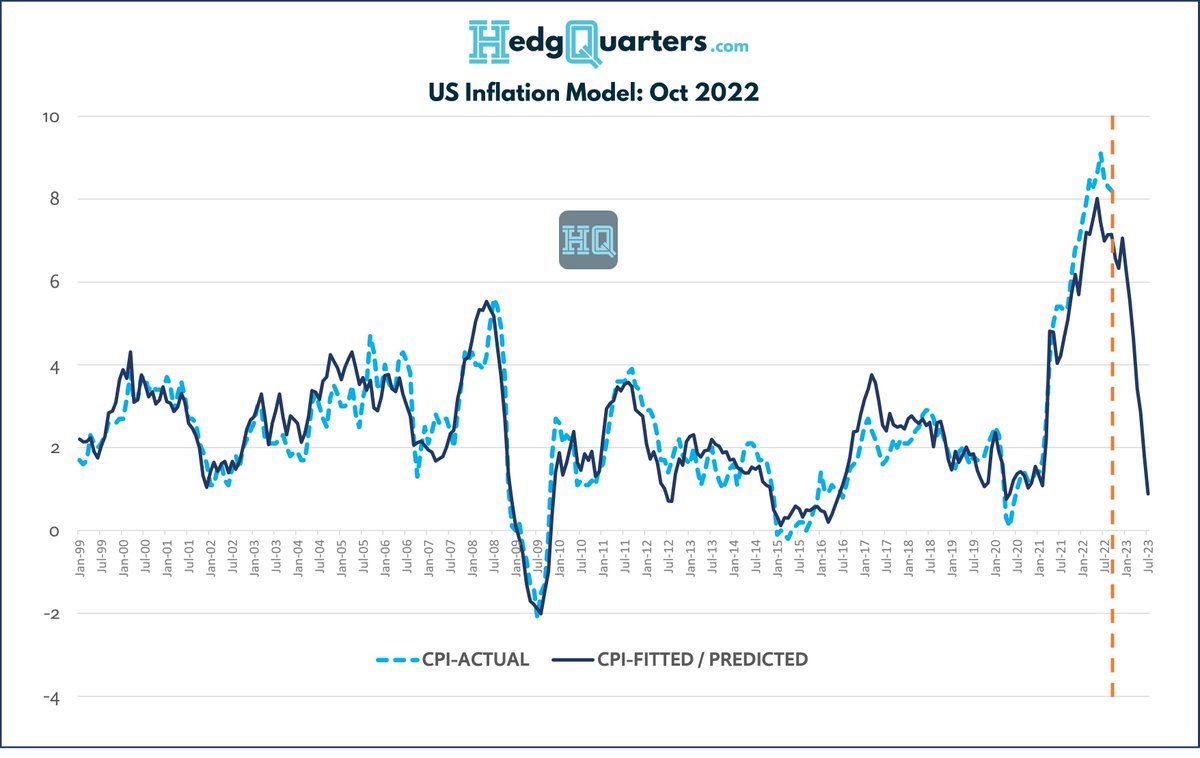


 This is complicated to map given various dynamics, sectors & lags, particularly with 280 char limits! But lets give it a go anyway. This is descriptive to help you think through aspects & trades you may not have yet considered
 Why is process so critical?
 The chart shows the Nasdaq 100 (white) overlayed with job cut announcements (green) and 10yr yields (orange). Critically, employment is the largest driver of tech spend. When job cuts rise as macro deteriorates, tech spend growth stagnates or falls. 10 yr yields fall as well. 2/7
 Cycle timing: In the '01 and '08 cycles, the real #recession (rising #unemployment) did not start till after the Fed had broken something and stopped hiking. Its at this time we see the ISM services really deteriorate. But in past thats been 19-36 mths after hikes started. 2/5