3/ Unfortunately, Bird doesn’t have a public API yet. However, because their internal API wasn’t so carefully protected, many external services started collecting the scooters location data (mostly to serve the growing chargers community).
4/ The data is made of snapshots, in 1-minute intervals, of all scooter locations, codes, and their battery level. Displayed on a map, each step looks like this - github.com/idoco/birding/… 
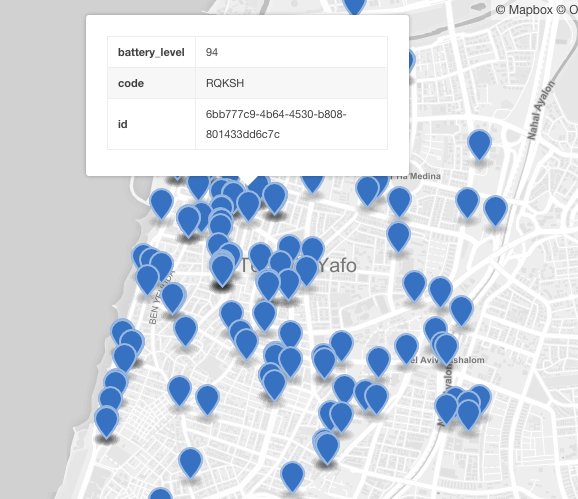
5/ The data is somewhat noisy. Inconsistent GPS signals and maintenance operations might look like bird movement.
By making a few assumptions about the minimal ride length, I was able to clean it and recreate the movement of each bird across the city - github.com/idoco/birding/…
By making a few assumptions about the minimal ride length, I was able to clean it and recreate the movement of each bird across the city - github.com/idoco/birding/…
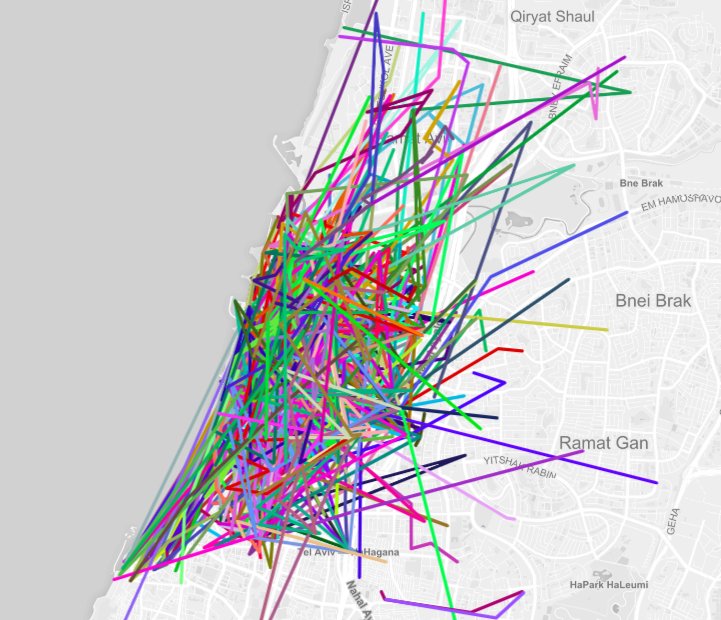
6/ And track the flow of birds throughout the day - idoco.github.io/birding/heatma…
7/ You can clearly notice, birds migrating from the city center to the workplaces on weekdays and to the beach on weekends (TLV weather FTW!), fading down throughout the day -
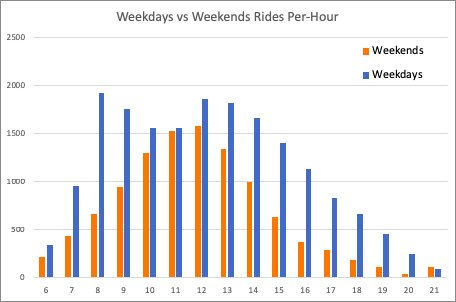
8/ I noticed an interesting pattern about weekdays usage. Many use a bird to commute to work (the 8am bar), but use other means to get back. (Do they walk back?)

9/ Bird pricing is very simple pricing. A Bird costs ₪5 to unlock and ₪0.5 per minute of use ($1.34 and $0.13).
Because of that, once you can isolate the rides from the data, you can basically calculate their daily revenue 😎
Because of that, once you can isolate the rides from the data, you can basically calculate their daily revenue 😎
10/ Between mid-Sep and mid-Oct I counted 1,715 daily rides on average. The average ride duration was 15.5 minutes. This translates to about ₪26,500 per day ($7,110) 💰
11/ On average, I spotted 330 birds each day (increasing from 250 to 400).
There is a tight correlation between the daily revenue and number of birds available that day.
I see this as a sign, that the demand is still higher than the supply and the market was not saturated.
There is a tight correlation between the daily revenue and number of birds available that day.
I see this as a sign, that the demand is still higher than the supply and the market was not saturated.

12/ Bird pays between ₪25 to ₪75 ($6.5/$20) per bird charge. I’d guess that the average is ~₪55 since chargers tend to wait for scooters to ripen before collecting them (Charging deserves a whole post by itself). My guess would put their BOM at about ₪18,150 pre day ($4,869)
13/ I’ve shared some of the scripts I used on GitHub github.com/idoco/birding. But some of the APIs had changed since I played with them.
There is much left to dig here, so I might compile this into a long blog post, but I’m already looking for the next dataset I'll explore 😈
There is much left to dig here, so I might compile this into a long blog post, but I’m already looking for the next dataset I'll explore 😈
14/ Apparently, I was way off in my charging numbers ⚡️. Based on data from the chargers community, the average payout is ₪30 ($8). That puts the average daily charging costs at ₪9,900 ($2,660).
16/ According to their website, Bird is deployed in 83 cities (and 17 universities, but let’s ignore that).
A simple calculation puts their total annual revenue at $215M! 🦄
A simple calculation puts their total annual revenue at $215M! 🦄

17/ As many pointed out, I don’t really think that #TelAviv is an average birding city. Israelis are known early adopters and the city was buzzing with scooters even before Bird. The weather, geography, and lame public transport create the perfect setting for #micromobility.
18/ Another unique feature, is that #TelAviv has no public transport during Shabbat and Jewish holidays ✡️. This correlates nicely with the high demand, longer ride durations, and +10% average ride revenue on Saturday.