,
11 tweets,
4 min read
Read on Twitter
Off the chart 👇🏻
Retail sales rose 8.7% 📈📈YoY from (exps 8.4% YoY); FAI rose📈 6.3% from 6.1% ; IP rose 📈📈8.5% from 5.9% (exp 5.6%)
Q1 GDP rose📈 6.4% YoY (exps 6.3% from 6.4% in Q4)
So retail rocked it. Question, why are imports contracting further? 🤔🤔🤔
Retail sales rose 8.7% 📈📈YoY from (exps 8.4% YoY); FAI rose📈 6.3% from 6.1% ; IP rose 📈📈8.5% from 5.9% (exp 5.6%)
Q1 GDP rose📈 6.4% YoY (exps 6.3% from 6.4% in Q4)
So retail rocked it. Question, why are imports contracting further? 🤔🤔🤔

In Q1 2019 in China:
a) Fiscal spending rose 📈15%YoY & total financing rose 📈40% YoY in flow &📈 10.7% in stock;
b) Retail sales rose📈 8.7% in March & IP just did a huge upturn to 📈8.5%;
c) GDP rose 📈6.4%
d) Imports contracted 📉-4.4% YoY & exports rose only 0.5% YoY📉
a) Fiscal spending rose 📈15%YoY & total financing rose 📈40% YoY in flow &📈 10.7% in stock;
b) Retail sales rose📈 8.7% in March & IP just did a huge upturn to 📈8.5%;
c) GDP rose 📈6.4%
d) Imports contracted 📉-4.4% YoY & exports rose only 0.5% YoY📉
As an FYI, this is all you will get for the details of China quarterly GDP break-down. Literally. For the second largest economy in the world 👇🏻👇🏻👇🏻:
a) No expenditure breakdown
b) Only 3 sectors (primary (commodity, secondary (industrial), third (services);
True story 👌🏻
a) No expenditure breakdown
b) Only 3 sectors (primary (commodity, secondary (industrial), third (services);
True story 👌🏻

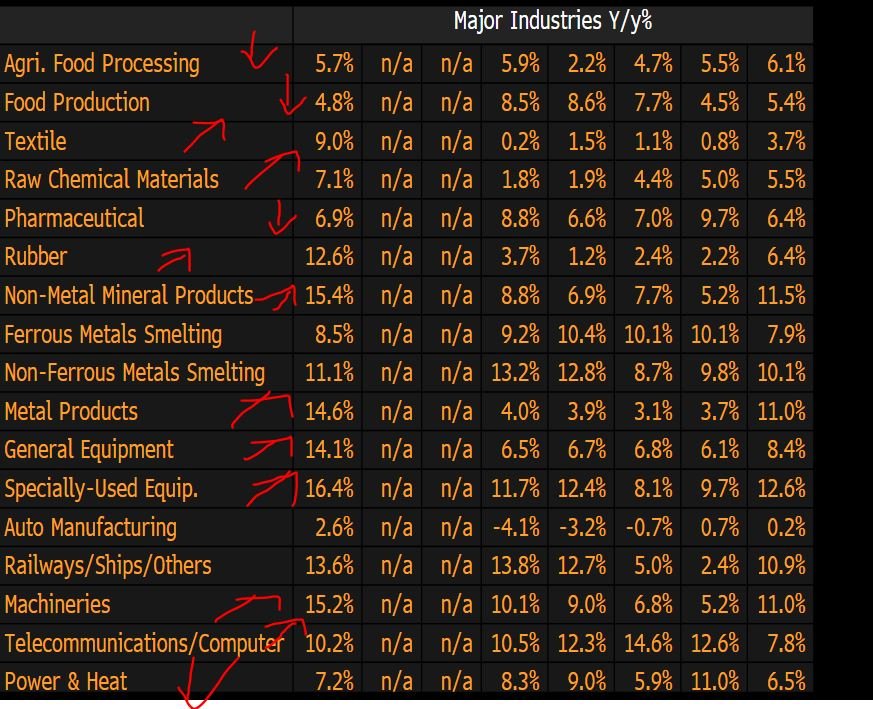
But fixed asset investment (FAI) data's good, so let's look. By sectors, EVERYONE IS DOWN (ex raw cem & telecom & food):
Mining slowing; agri slowing; manufacturing slowing; pharma slowing; smelting contracting; general equipment slowing; CARS contracting; railways contracting😬
Mining slowing; agri slowing; manufacturing slowing; pharma slowing; smelting contracting; general equipment slowing; CARS contracting; railways contracting😬

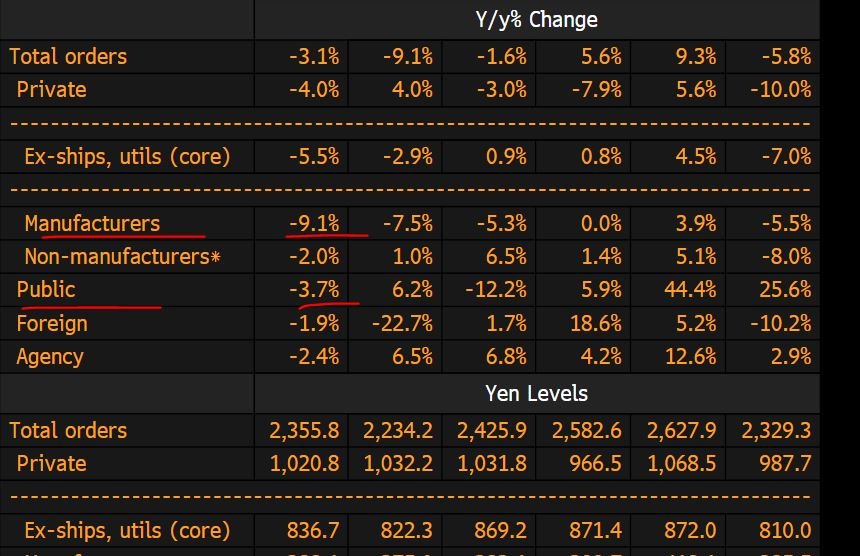
By ownership (private versus state-owned):
State-owned investment accelerating 📈
Private sector slowing 📉
👇🏻👇🏻👇🏻👇🏻👇🏻👇🏻👇🏻👇🏻👇🏻
State-owned investment accelerating 📈
Private sector slowing 📉
👇🏻👇🏻👇🏻👇🏻👇🏻👇🏻👇🏻👇🏻👇🏻

We can see that FAI is not good by sector by only good by state ownership as private is down. Okay, wut about IP?
Well, it's up!!! Wut does that mean? It means Chinese firms are utilizing existing capacity & not investing in future capacity 🤔
Meaning mostly a domestic play🤗👇🏻
Well, it's up!!! Wut does that mean? It means Chinese firms are utilizing existing capacity & not investing in future capacity 🤔
Meaning mostly a domestic play🤗👇🏻
Putting this together:
a) China growth driven by a spurt of IP & retail sales & mostly for domestic sectors (property & infra);
b) While the March YoY retail sales look good, the YTD figure shows slowdown (8.3% ytd vs 9.8% for '18;
Don't expect China📈to save rest of the world
a) China growth driven by a spurt of IP & retail sales & mostly for domestic sectors (property & infra);
b) While the March YoY retail sales look good, the YTD figure shows slowdown (8.3% ytd vs 9.8% for '18;
Don't expect China📈to save rest of the world
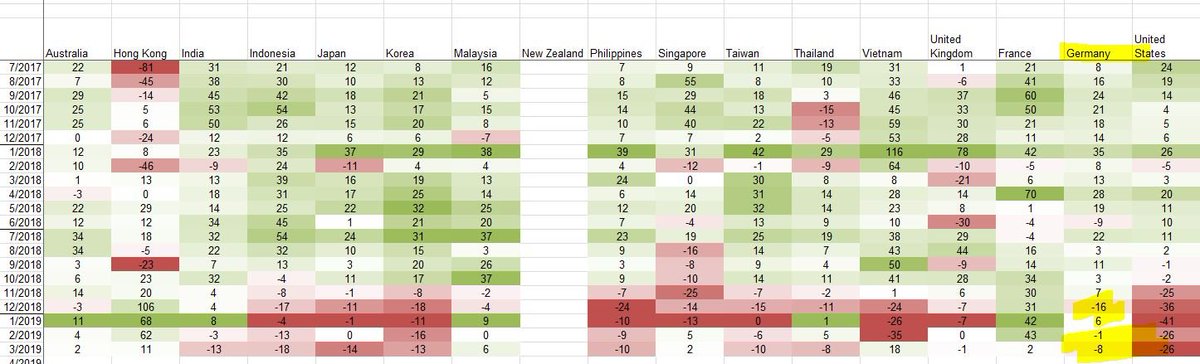
👇🏻Retail sales (ytd%Q1):
Everything is up except auto (contracting) office supplies, jewelry, & clothing
IP & retail sales up, my conjecture is a property & infra playbook (fiscal/monetary stimulus)
Investment weak if look at sectors & cyclical rebound & not structural 💭🤔
Everything is up except auto (contracting) office supplies, jewelry, & clothing
IP & retail sales up, my conjecture is a property & infra playbook (fiscal/monetary stimulus)
Investment weak if look at sectors & cyclical rebound & not structural 💭🤔

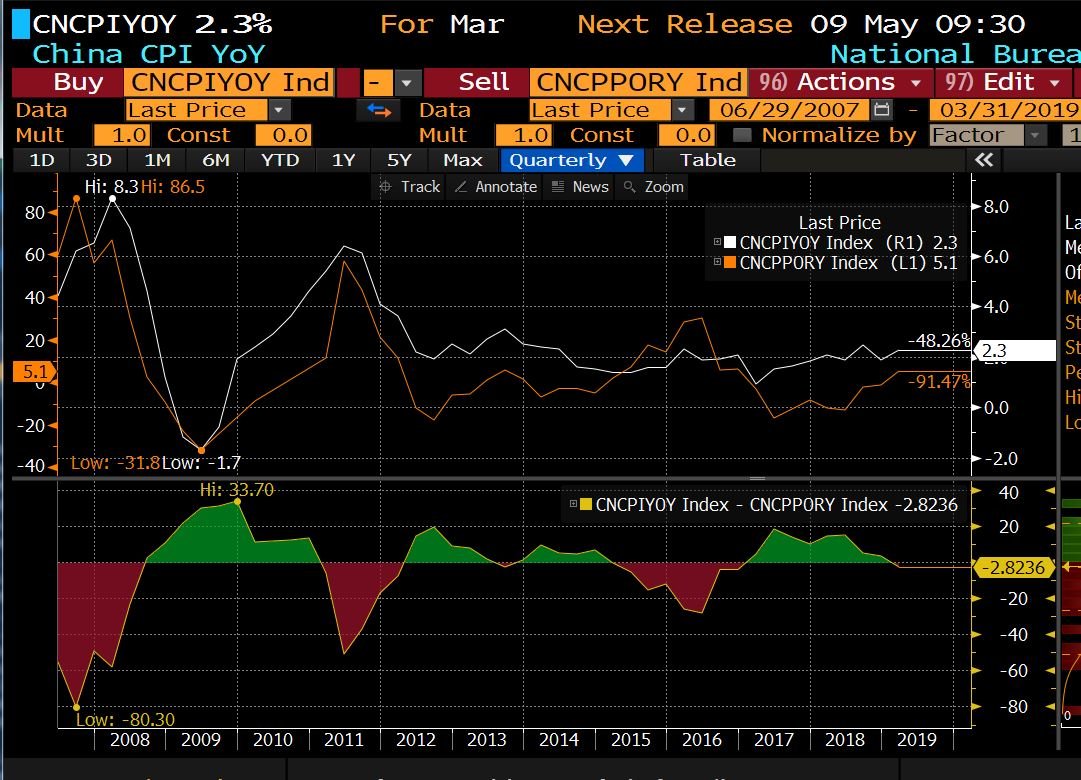
China: Pork price rise may exceed 70% in H2 🐷🐖🐽📈📈📈📈
Chinese fixed income traders won't like this news & esp w/ this gang buster growth figures coming out.
Equities are also not happy either b/c strong eco = expectations of future stimulus dimmed 😬
Chinese fixed income traders won't like this news & esp w/ this gang buster growth figures coming out.
Equities are also not happy either b/c strong eco = expectations of future stimulus dimmed 😬
Brace yourself if u're a fixed income person in China, check out this chart of pork price & headline CPI. The gov' just told u that H2 will rise by 70%. Look at the correlation & the last time 🐽🐖🐷went up 70%.
Yes, it will be a very hot summer 🥵☀😎- get some sunscreen👇🏻👇🏻👇🏻
Yes, it will be a very hot summer 🥵☀😎- get some sunscreen👇🏻👇🏻👇🏻
Look at the sovereign yield curve - 📈growth + 📈pork price = lamentation over lack of easing coming & CPI 📈.
So wut happens? Yield curve shifted upward (meaning prices fall or otherwise known as a bond sell-off). But equities not too happy either w/ this better GDP number🤷🏻♀️🙁
So wut happens? Yield curve shifted upward (meaning prices fall or otherwise known as a bond sell-off). But equities not too happy either w/ this better GDP number🤷🏻♀️🙁