,
11 tweets,
6 min read
Read on Twitter
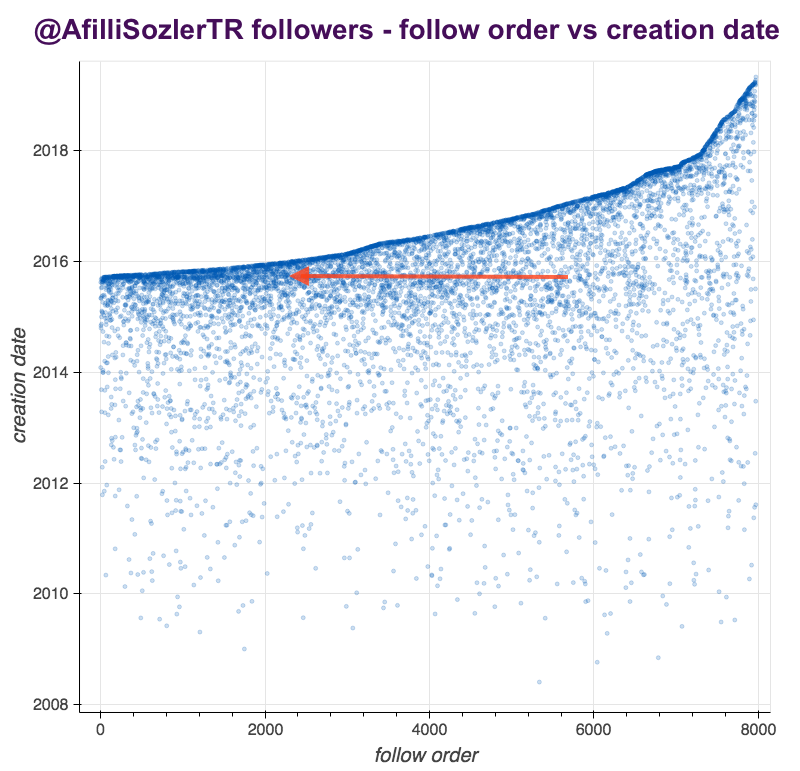
The spike of followers created at or around the same date as @AfilliSozlerTR definitely struck us as anomalous, and we've investigated similar spikes before. This raises a question: what's normal and what's not when it comes to an account's followers, anyway?
cc: @ZellaQuixote
cc: @ZellaQuixote
We plotted the creation dates of @AfilliSozlerTR's followers against the order in which they followed. The 2015 account creation spike manifests as a slightly darker horizontal band at the left end of the graph, and the pronounced curve at the top looks potentially interesting... 
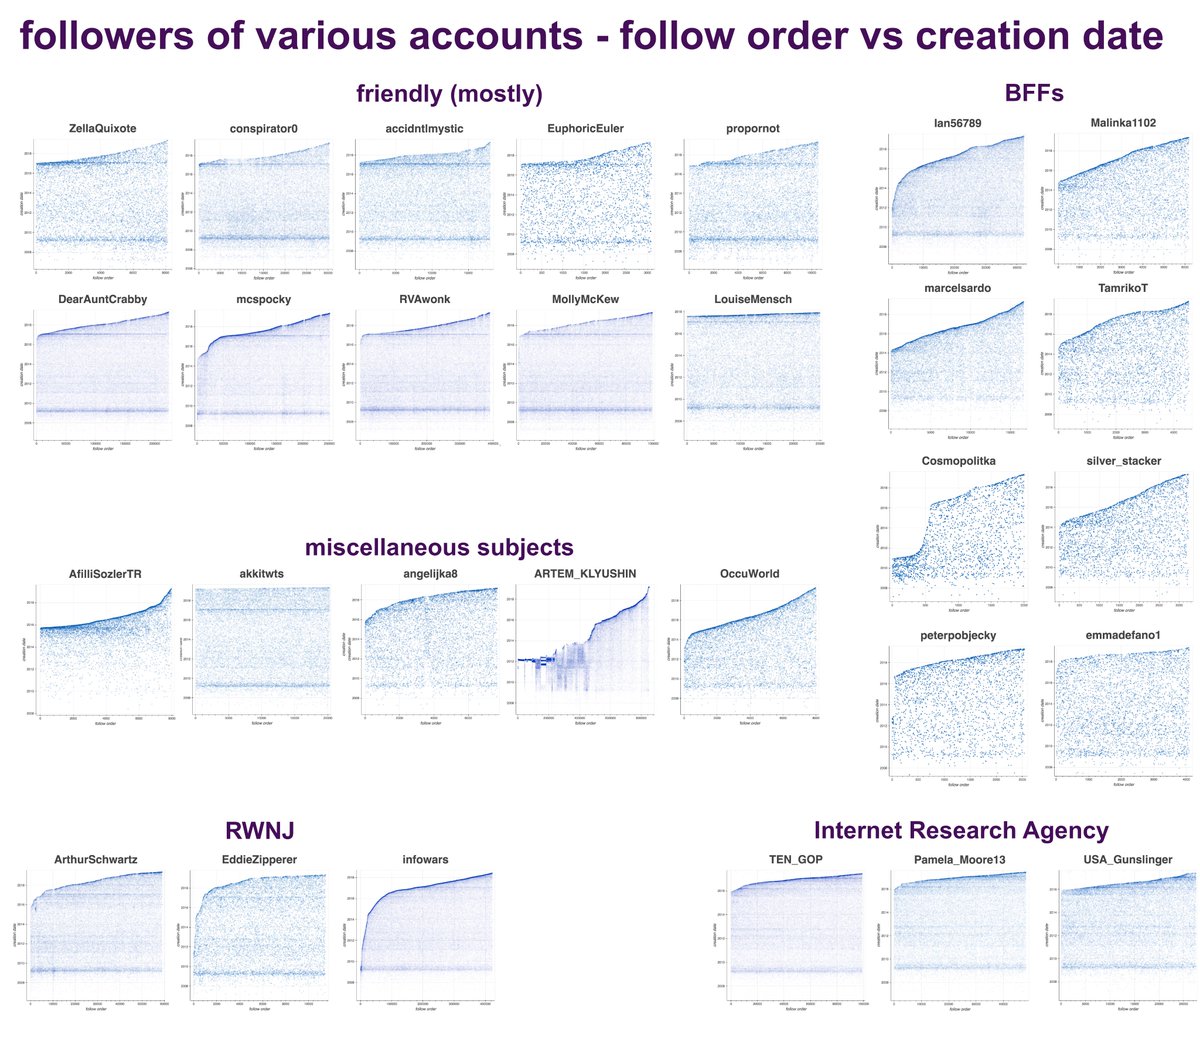
In order to get a better sense of how to interpret the results, we made the same plot for a total of 29 accounts in five categories.
- (mostly) friendly
- RWNJs
- banned IRA accounts
- BFFs (a network of pro-Putin/pro-Assad trolls)
- miscellaneous subjects of our past research
- (mostly) friendly
- RWNJs
- banned IRA accounts
- BFFs (a network of pro-Putin/pro-Assad trolls)
- miscellaneous subjects of our past research

A few patterns emerge as potential baselines. Both the friendly and RWNJ groups show a band in 2009, correlating with Twitter's early growth. The friendly accounts also tend to show a distinct band in early 2017, which is less pronounced among the RWNJs.

The fake accounts tend to profile similarly to the type of account they impersonate: the three IRA trolls (all right-wing) as well as @angelijka8 look like the RWNJ accounts, and supposed #resistance account @akkitwts shares the 2017 band with those in the "friendly" category.
Possibly the strangest plot in the set belongs to @ARTEM_KLYUSHIN. We've documented oddities in his followers before, including a group of 87K with self-similar names created early 2012. In addition to being created in batches, this plot indicates they also followed in batches.
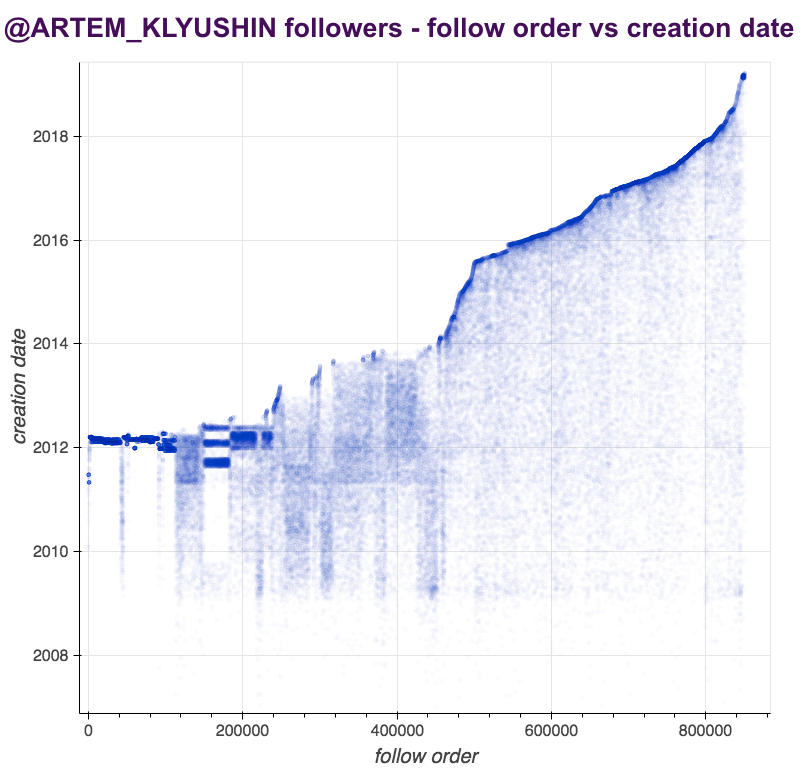
(previous thread on @ARTEM_KLYUSHIN followers)
The date an account followed another account isn't available data, but we can determine a minimum follow date based on the following:
- B cannot follow A before both A and B exist.
- Therefore, any C that followed A subsequent to B necessarily followed A after B's creation date.
- B cannot follow A before both A and B exist.
- Therefore, any C that followed A subsequent to B necessarily followed A after B's creation date.

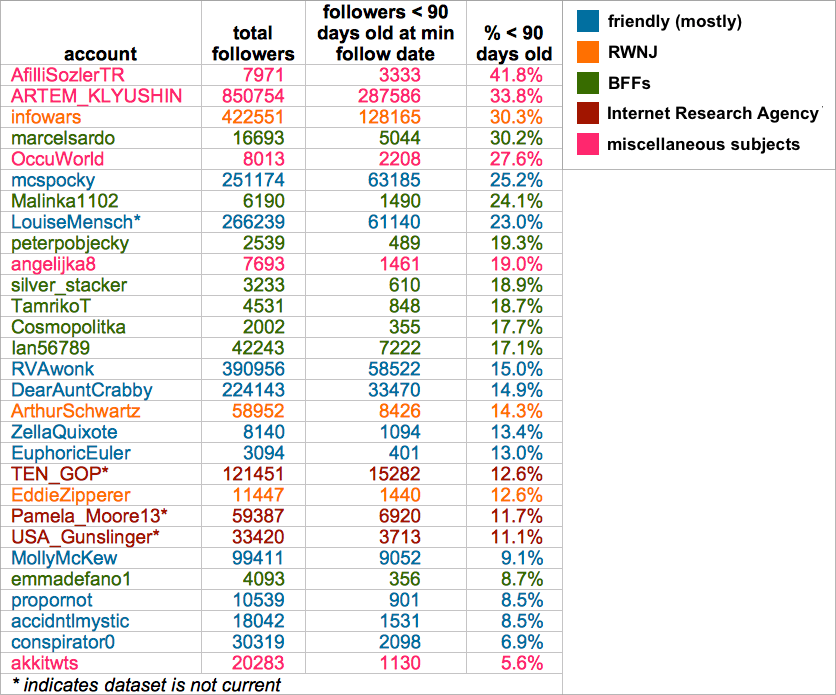
We can use this to estimate what percentage of an account's followers were new at the time they followed, potentially indicating artificial growth/absence of organic attention - real people with something to say should theoretically attract interest from old Twitter users alike.
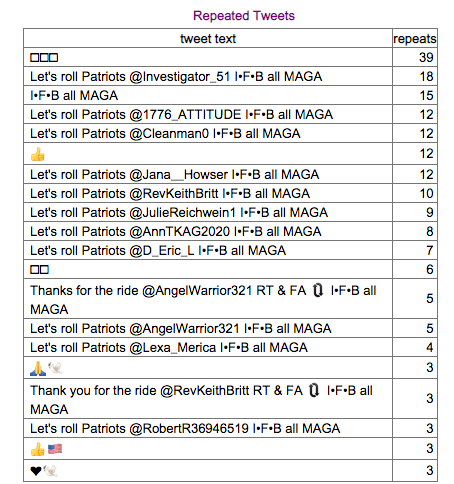
This table shows the percentage of each account's followers created less than 90 days prior to the earliest date they could have followed. Accounts that have caught our attention (both for follower-related reasons and otherwise) indeed bubble to the top with a few exceptions.
We'll likely post further about the topic of using followers as a diagnostic technique, either in general or in relation to specific accounts - we've definitely found a few interesting observations here, and gained a useful rough metric, but there's a lot more to explore.