,
23 tweets,
5 min read
Read on Twitter
The recent Ganna et al. paper on same-sex sexual behavior has prompted questions about rg, the genetic correlation between two traits. What is it? How is it estimated? A technical primer.
rg is defined using the SNP-specific per-allele effects on each of two traits: b1i and b2i. (Yes, “effect” is a loaded term—I’ll come back to that. Roll with me for a sec.)
We can think of b1i as the regression coefficient from a multivariable ordinary least squares regression of Y1 on SNP i in an infinite sample from the population of interest. It’s the effect of SNP i adjusted for all the other SNPs. Ditto b2i.
Is b1i a causal effect or a measure of association? (Uh, excuse me while I duck to avoid flying chairs and Wittgensteinian flailing pokers.) Fair to say: both, to different degrees depending on trait and SNP.
Given the b1is and b2is, which are unobservable population parameters, we can define rg as the correlation in b1 and b2 across SNPs. As a correlation, it is bounded between -1 and 1.
That’s a definition; how do we actually estimate rg in the setting where all we have are per-SNP summary statistics from GWAS of Y1 and Y2?
One challenge here is that the b’s are adjusted for the effects of all other SNPs, while the GWAS results are based on marginal regression coefficients—that is, they are not adjusted for other SNPs.
So the GWAS summary statistic depends not only on bi, but also on the bs for any SNPs that are correlated with SNP i.
The clever insight behind LD Score Regression is that we can unpack this correlation and estimate the variance and covariance in bi by regressing moments of GWAS summary statistics on the “LD Score,” li=sum_j r_ij^2.
In particular, rg can be estimated by regressing the product of SNP Z-scores for the two traits on the LD score:
E(Z1 Z2) = sqrt(N1 N2) rg li / M + stuff
(N1 and N2, the sample sizes, and M, the total number of SNPs analyzed, are known.)
E(Z1 Z2) = sqrt(N1 N2) rg li / M + stuff
(N1 and N2, the sample sizes, and M, the total number of SNPs analyzed, are known.)
By definition, rg is constrained to lie in [-1,1], but the regression coefficient for the LD score is unconstrained. So even though the LD Score estimate is consistent (converges to rg as sample size increases), in finite samples you can end up with estimates outside that range.
That is more likely to happen when sample sizes are relatively small and trait heritability is low—as was the case for the two supplementary analyses in the Ganna paper where the estimate of rg was >1. Look at those CIs!
(This is GWAS, people: “relatively small” is N<50,000.)
It’s worth noting that of the ~100 rg estimates that Ganna et al. report, I only see those two supplementary results that fall outside [-1,1].
Okay, theory schmeory, what do the data tell us? What kinds of rgs do we see among pairs of complex human traits? Bulik-Sullivan et al. (2016) Nat Genet has a nice figure. 
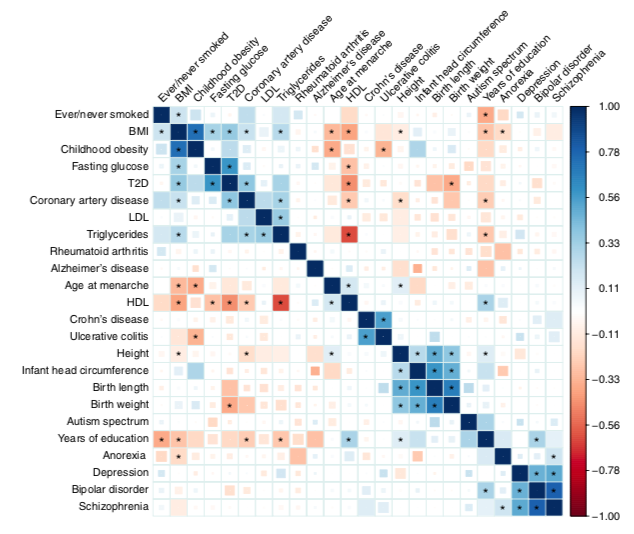
So |rgs| run from ~0 (rheumatoid arthritis and Alzheimer’s) to ~0.33 (LDL and triglycerides) to ~0.70 (schizophrenia and bipolar disorder).
Okay, next: caveats. So many freaking caveats.
First, even if the bs represent causal genetic effects, rg says nothing about the causal relationship between the two traits. Does Y1 cause Y2? Other way round? Both directions? Is there a common cause for both? rg can’t tell.
Luke O'Connor @Luke0connor and Alkes Price have a nice paper out on trying to tease out causal relationships among traits from summary statistics. (Fourth moments, y'all!)
Second, all of these relationships are context specific. Say Y1 is LDL and Y2 is butter substitute consumption. We might see a negative rg between these traits—but if docs didn’t tell people with high LDL to cut out the butter, rg might be 0.
Ganna et al. appropriately caution readers about how to interpret these rgs.


Want to learn more, really dive into the details of the math? Check out these refs: PMIDs 25642630 26414676 30374074 30683880. /fin
And PMID:31171865! Table 1 lists >10 methods to estimate rg. HT:@bpasaniuc