1. The idea that the globe is warming isn’t based on computer models.
It’s based on millions of measurements, taken on land and at sea over some 170 years.
washingtonpost.com/graphics/2019/…
It’s based on millions of measurements, taken on land and at sea over some 170 years.
washingtonpost.com/graphics/2019/…
2. That’s the key upshot of the tenth installment of our “2C: Beyond the Limit” series, powered by massive data and graphics work by our team of @johnmuyskens, @Harry_Stevens, @asteckelberg, and @monicaulmanu. I was fortunate to serve as a writerly apprentice to them.
3. We begin by taking you high up into the Austrian Alps, where a fascinating research station called Sonnblick has been established at over 10,000 feet in altitude since 1886 – well over 100 years.
4. It was set up originally because early meteorologists needed data from the upper atmosphere. They didn’t know at the time that it would also tell us so very much about global warming
5. But temperature measurements have been taken continuously here since 1886, and they show dramatic changes.
6. Using a relatively conservative method – a linear regression/trend – we find 2.1 degrees Celsius or 3.8 degrees Fahrenheit of warming here, from Sonnblick’s data. And the most recent years, the 2010s, are considerably warmer than this method would suggest.
7. In a very cold place like Sonnblick that means going from an annual average temperature of about -7 degrees C (19.4 F) to more like -5 C (23 F). But that’s just an average – the key change is likely to be more days of the year when the temperature is not freezing.
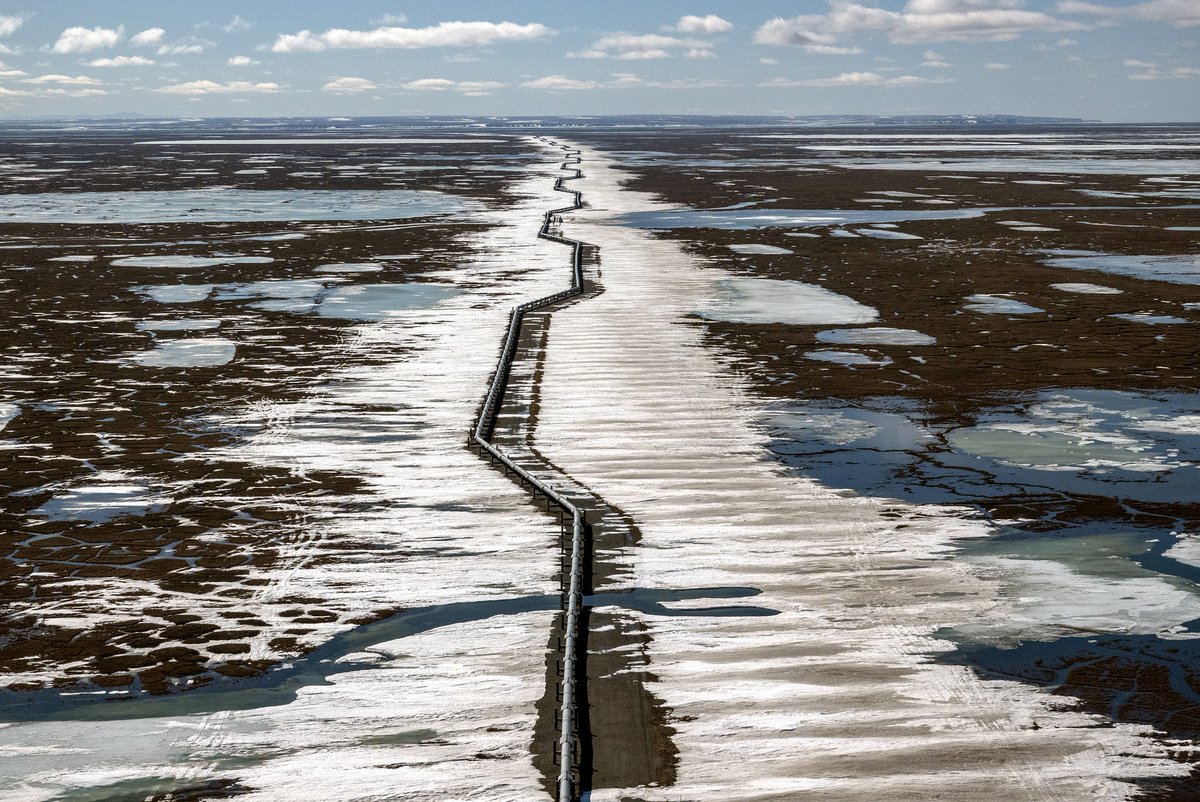
8. That thawing has huge consequences. Sonnblick is actually falling apart as mountain permafrost thaws.
9. Or, it would be, if a massive effort had not been made to stabilize the mountain peak where the station sits, to ensure that it can continue to measure the change that is literally destabilizing the ground beneath it.
10.In some ways, Sonnblick is unique – it has a seamless, pristine, continuous temperature record showing clear warming. In others, though, not so much.
11. It is one of thousands of temperature stations on land that together tell the story of global warming. And there are enormous volumes of ocean measurements as well. More and more appear as time goes on, as our feature demonstrates
12. Europe and the United States have the highest station density, and many of the earliest stations. But as time goes on, more and more appear and coverage becomes increasingly global.
13. As we explain, all of these measurements are then carefully adjusted to address known biases, and integrated into global temperature datasets, so that researchers can calculate warming trends over time for individual regions of the globe, and also for the planet itself.
14. That’s how we know it’s warming. It’s not a theory. It’s not a computer model. It’s a massive data project.
15. And yes, the data have to be adjusted – but scientists quantify the effects of those adjustments and they don’t wipe away the trend.
16. As @ClimateOfGavin put it to us, “The bottom line is that any adjustments are relatively small in the global mean. Neither are the calculated uncertainties anywhere close enough to affect the overall trends.”
17. These temperature data tell us that the globe has warmed by about 1 degree C since the late 19th century – but they also tell us, as our 2C project has documented, which regions are way above (or, way below) that average.
18. There’s a potentially dramatic twist, though, to this story of how massive datasets have documented that global warming is real, underway, and far more extreme in some places than others.
19. You see, there is still more data out there – including data from the distant past, which in many cases is not yet being taken into consideration.
20. Or as @ed_hawkins put it to me, quoted in the story: “There are literally billions of observations which are still in paper format in various archives and libraries all over the world.”
21. Some of these data could, just maybe, lead to a startling conclusion – there has been even more global warming than we think (something @MichaelEMann has prominently argued).
22. The scientists with whom we spoke don’t think that the warming trends are likely to change much between around 1850 and the present – the period over which we see about 1degree C of change.
23. But there's a lot of data from prior to 1850 that's not digitized and so is not necessarily being taken into account. We provide an example: The meticulous observations of temperature taken by Captain William Bligh of the HMS Bounty in 1789, just before the infamous mutiny.
24. Some scientists think there could be a fraction of a degree Celsius more warming that occurred during this fledgling industrial period, roughly 1780 to 1850.
25. Scientists are now racing to digitize and analyze the data in question and see if it is possible to extend the official record back further, before 1850.
26. If so, one can make the argument that humans have already warmed the Earth more than we thought and so therefore – maybe, this would have to be spelled out further – we can tolerate even fewer future emissions.
27. That would be a big deal.
28. These are very large conclusions, and yet they come from something small and simple – thermometers. A lot of them, spread over space and time.
29. That's what our whole 2C series is rooted in, and that's what's at the heart of the great data visualizations in this latest installment -- so please, check it out! /end washingtonpost.com/graphics/2019/…