My Authors
Read all threads
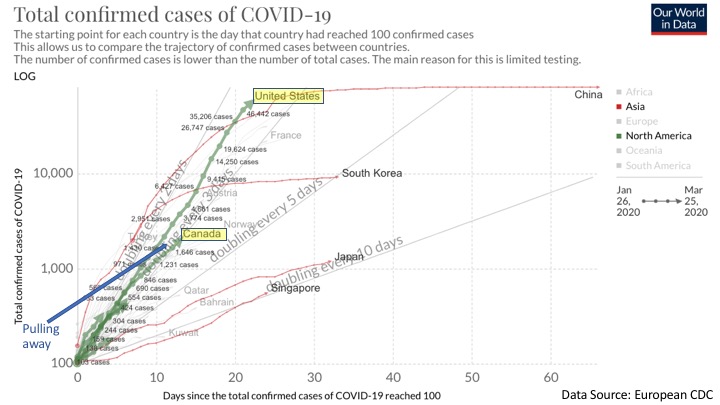
If it looks to you like the exponent on infection growth rate is increasing, you are probably right. I just looked at the 5-day LOGEST values (estimate the exponential growth based on last 5 days activity), and the rate has risen 4 out of the last 5 days. Testing just started... Image
So, this isn't scary to me YET. What it means is not that the real exponential growth rate of infection is increasing, but rather that the rate of our knowledge of exponential rate is increasing. But more testing is still needed to get the numbers to settle down ...
There's gonna be lots of numbers for the epidemiologists and hyper-mathy folks to study RE impact of testing volumes (see ) on estimates of real growth rate when this is over. I don't recall signing up for that clinical trial though.
I suspect there they may even be some new hyper-mathy stuff that addresses statistical process controls applied to exponential growth curves. I kinda faked a control chart with my 5-day moving estimator for the growth rate. There should be some useful signal there ...
I know enough math to know that something should work, maybe even already exists (but maybe and even possibly not yet). I also have enough math to know it's not going to be me who actually proves it.
I've seen enough in that one graph to tell me what I already knew, the real rate is worse than a lot of people thought, or the current graphs show. The good news is that we are seeing a correction now. The bad news may be that it will take a longer time than we want to adjust.
But I'm still not panicking yet.
And neither should you.
I just updated my spreadsheet. The good news is that the infection rate is declining, and has been for eight days in a row. However, it's also stabilized, which means it might be getting ready to inflect the other way. Image
OK, my chart gets better. I can compute New Cases / Total Cases, which should be a constant for an exponential function. In fact 1/(1-New/Total Cases) recovers the base of it.

Here's the new control chart on the base value, I find it more helpful. Image
Today's update is promising. The downward trend in growth shows we are making progress. Note that it took two weeks to get farther than 1 standard deviation in the right direction. Maybe by tomorrow we'll be at 2. Image
@threadreaderapp Unroll please
Missing some Tweet in this thread? You can try to force a refresh.

Enjoying this thread?

Keep Current with Keith W. Boone

Profile picture

Stay in touch and get notified when new unrolls are available from this author!

Read all threads

This Thread may be Removed Anytime!

Twitter may remove this content at anytime, convert it as a PDF, save and print for later use!

Try unrolling a thread yourself!

how to unroll video

1) Follow Thread Reader App on Twitter so you can easily mention us!

2) Go to a Twitter thread (series of Tweets by the same owner) and mention us with a keyword "unroll" @threadreaderapp unroll

You can practice here first or read more on our help page!
Follow Us on Twitter!

Did Thread Reader help you today?

Support us! We are indie developers!


This site is made by just three indie developers on a laptop doing marketing, support and development! Read more about the story.

Become a Premium Member ($3.00/month or $30.00/year) and get exclusive features!

Become Premium

Too expensive? Make a small donation by buying us coffee ($5) or help with server cost ($10)

Donate via Paypal Become our Patreon

Thank you for your support!