Analysis: #NYSE $GS
Case 218 #The_Goldman_Sachs Group Inc.
DISCLAIMER: The analysis is strictly for educational purposes and should not be construed as an invitation to trade.
#GS 1/4
Case 218 #The_Goldman_Sachs Group Inc.
DISCLAIMER: The analysis is strictly for educational purposes and should not be construed as an invitation to trade.
#GS 1/4

Chart 1
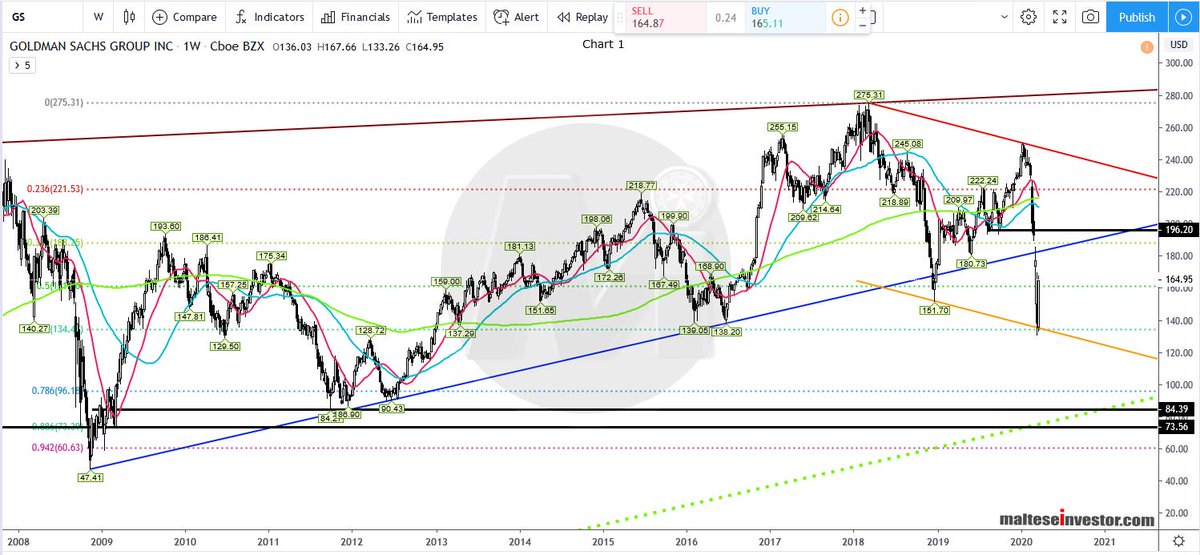
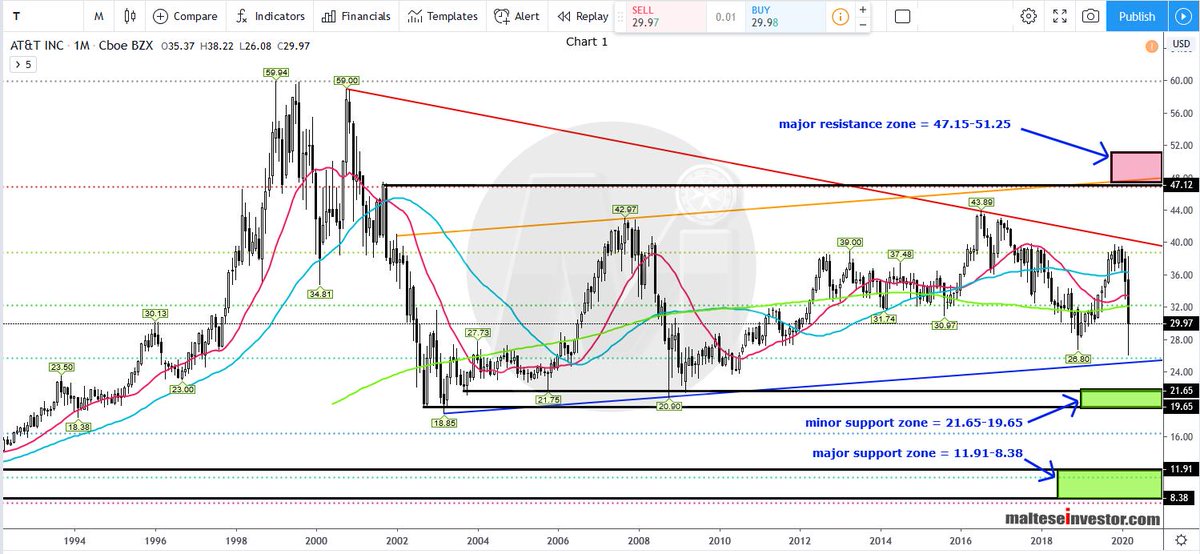
Weekly Chart: Bouncing strongly off the #Fib. 0.618 (134.47) and channel bottom and temporarily reclaiming the monthly #SMA 200 at 163.48. Immediate #trendline resistance at 183.00 but above that an unfilled gap - the top of which is .....
GS 2/4
Weekly Chart: Bouncing strongly off the #Fib. 0.618 (134.47) and channel bottom and temporarily reclaiming the monthly #SMA 200 at 163.48. Immediate #trendline resistance at 183.00 but above that an unfilled gap - the top of which is .....
GS 2/4
..... 189.28. The first substantive #resistance in 196.20 being the Aug.2019 #pivot, further up the SMA 200 at 212.50. To the downside a (monthly) close below 131.20 will target 110.80/35 then Fib. 0.786 at 96.18.
GS 3/4
GS 3/4