Chart 1
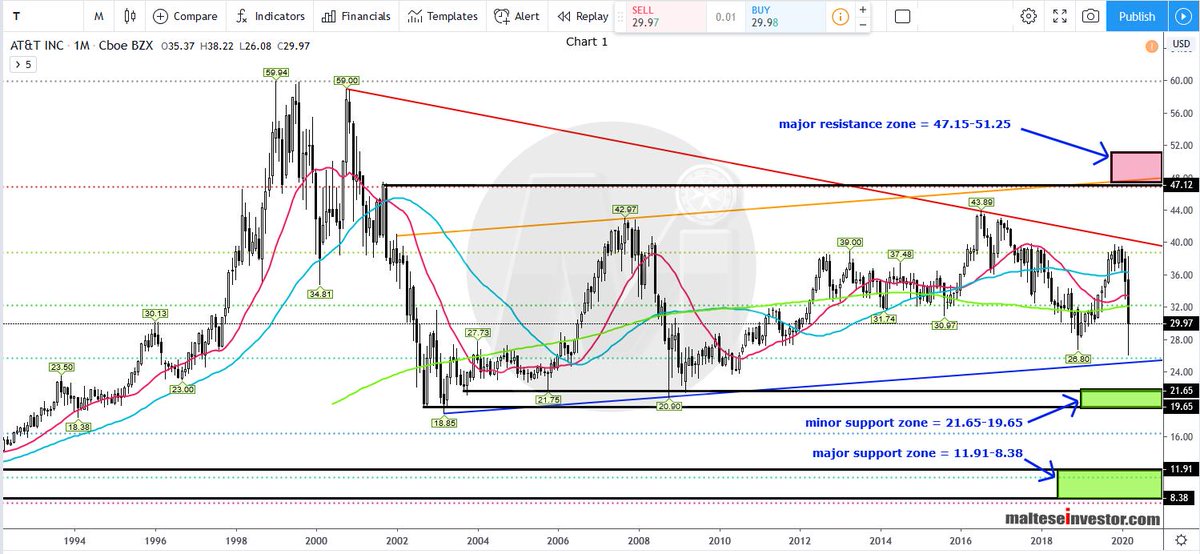
Monthly Chart: Price has been has been confined to a $23 range since 2003 and bearishness is seen on the short and long time frames. The 17 year #trendline support sits at 25.11, a break and close below #pivot support 23.25 will see a drift towards the minor .....
T 2/4
Monthly Chart: Price has been has been confined to a $23 range since 2003 and bearishness is seen on the short and long time frames. The 17 year #trendline support sits at 25.11, a break and close below #pivot support 23.25 will see a drift towards the minor .....
T 2/4
..... #support zone 21.65-19.65. Further down major support seen into the 11.90-7.80 area (#Fib. 0.886 and pivot support). To the upside #resistance begins 32.26 (the confluence of Fib. 0.50 and the #SMA 200) then #cluster resistance at 36.58 - 37.67.
T 3/4
T 3/4