My Authors
Read all threads
Thread: Is India "flattening the curve"?

Working with data of other countries and the exemplar cases of China and South Korea for 80+ days, I realized that it's rather difficult, if not impossible, to judge that just off a couple of indicators.

#COVID19India
1/n (n=20)
And it's most certainly daft to try and read that off some noisy changes in a few days data. This has not been an easy fight for most countries that are gaining control over their #COVID19 spread.

#nCoV2019India #coronavirusindia
2/n
And involves tight coupling of 3-4 measures for a sustained period of time. To understand what they are and how to take control of the situation, @yaneerbaryam is a good follow.

One of the measures is extensive testing. Including asymptomatic cases.

#COVID19India
3/n
Now, this is where we have some confusion. India headed into a #Lockdown21 relatively early (at ~ 500 confirmed cases) but without testing and quarantine/isolation measures commensurate. Our testing protocols have only now allowed for some testing of asymptomatic cases.

4/n
We've had capacity constraints and other issues, including test kits of reliable accuracy. Now, it's next to impossible that testing can be ramped up in lock-step with an exponentially growing infection spread. The best one can expect is some linear ramp-up. Realistically.

5/n
So, when @ShamikaRavi - an academic with substantial influence - has been claiming, asserting or inferring (take your pick) that India has been flattening the curve, it sounded too good to be true. And my workups disagreed strongly. Even w/o looking at testing data.

6/n
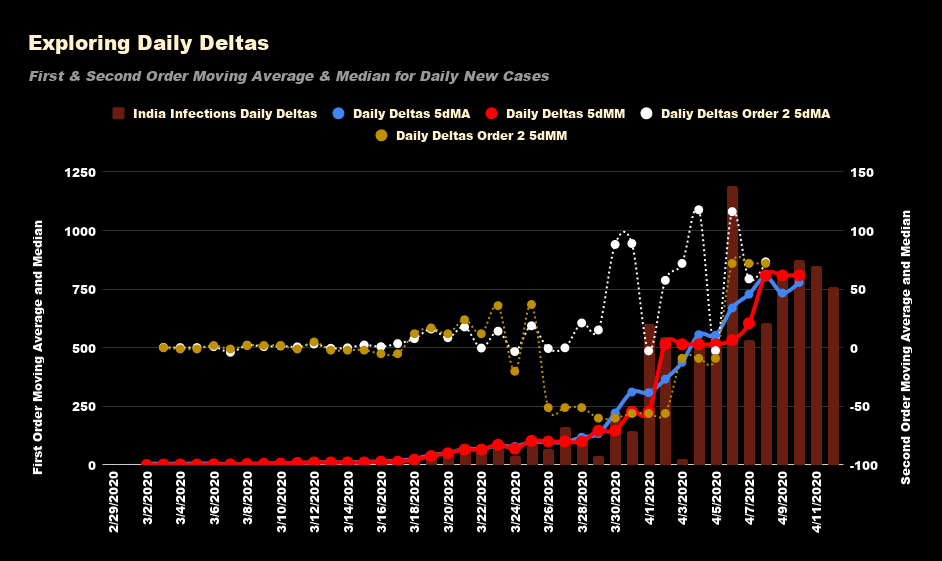
She uses a "statistic of significance" viz the Moving Media (for growth of daily new cases) to drive her claim/inference.
That didn't make sense to me, so I looked at the contrast between the Moving Median and the Moving Average. Of the second order differences. In new cases
7/n
And that divergence between the two signalled to me - is that the second order MA gives you an estimate of the # of daily test positives while the second order MM indirectly points to capacity.

And it's the latter that drives the former.

#Covid19India
8/n
Now India has been adding around 500 cases for a week just after the superspreader incident blew up. This followed up with - now - shifting to a level of 800 new cases each day. This is a behavior NOT SEEN in the case of other hotspot countries.

#nCoV2019India
9/n
So, what's going on?
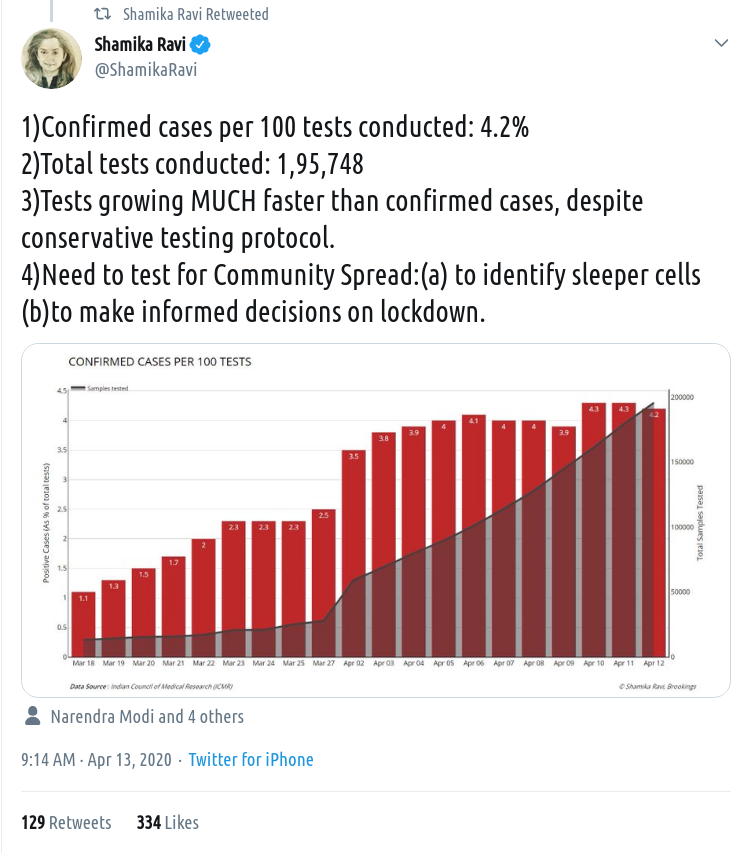
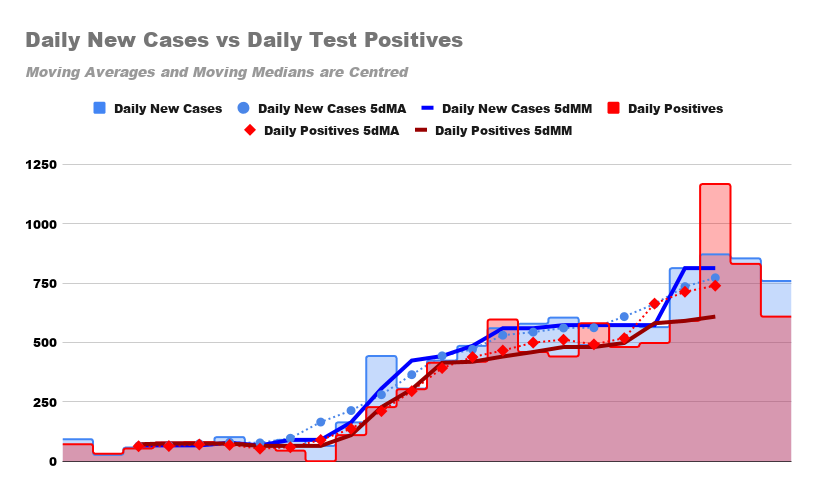
Let's look at Claim #3 here. Are tests growing much faster than confirmed cases? If so, the # of -ve's would grow faster than +ve's.

The chart has daily new cases vs test positives. 5dMM for new cases >> 5dMM for positives. The 5dMAs are in sync.

10/n
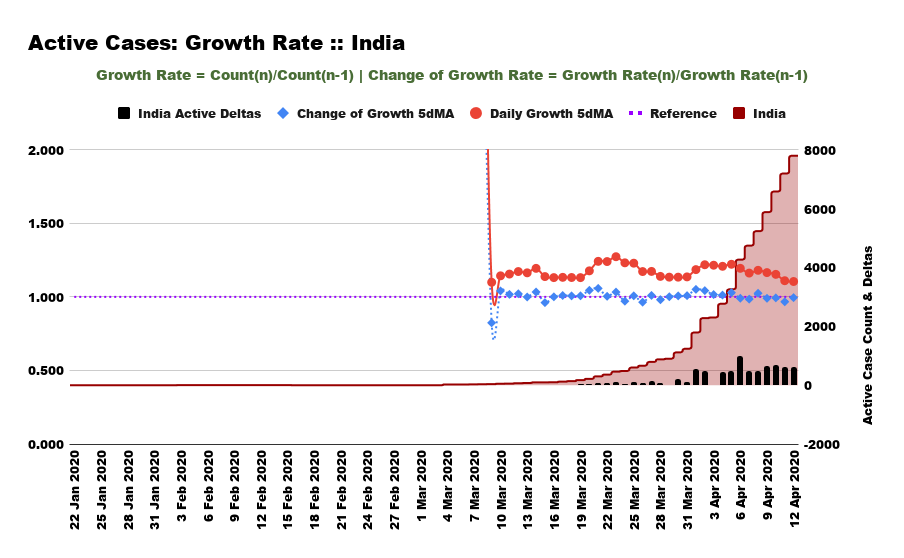
Since those are absolute numbers, these are the daily growth rates, with 5dMAs and 5dMMs superimposed. They're in perfect sync. And for most of the period, the growth rate of new infections has been >> than the rate of growth of testing (which is to be expected).

11/n
It's a reasonable call to make - at this point - seeing what we have, that it is the level of testing accessible that is driving the new case count. Via specified protocol and available/functional capacity.

How would we know if they match as pointed above?

#Covid19India
12/n
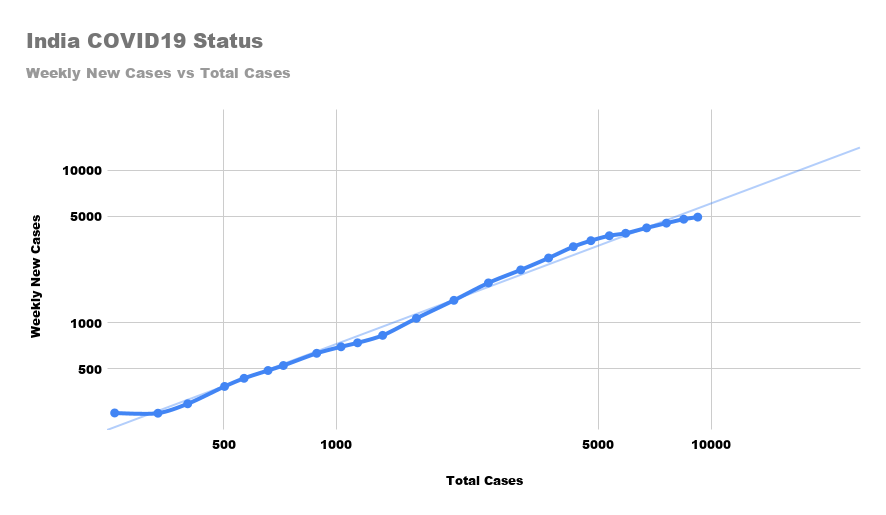
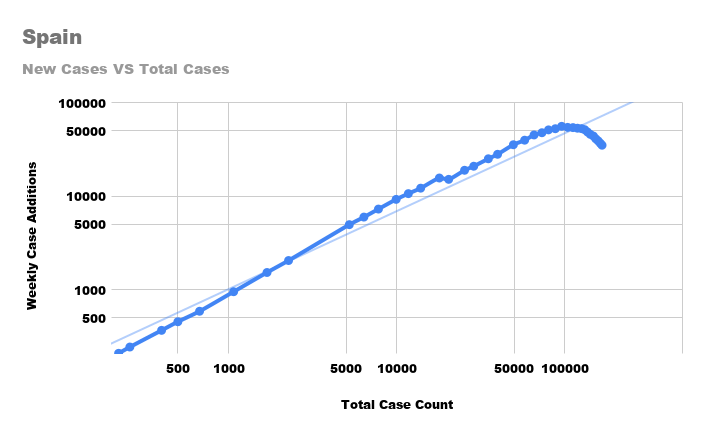
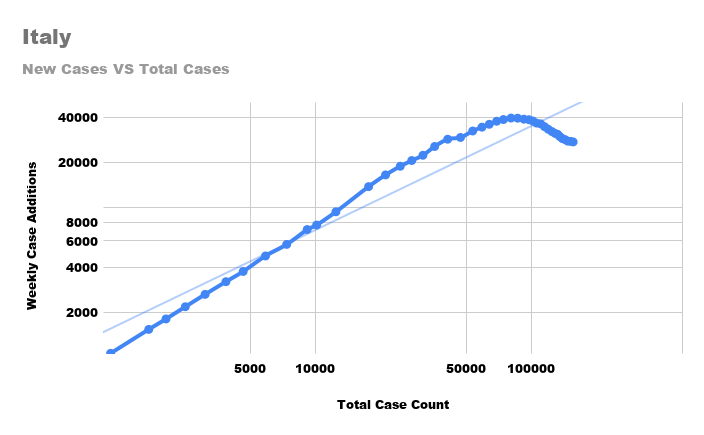
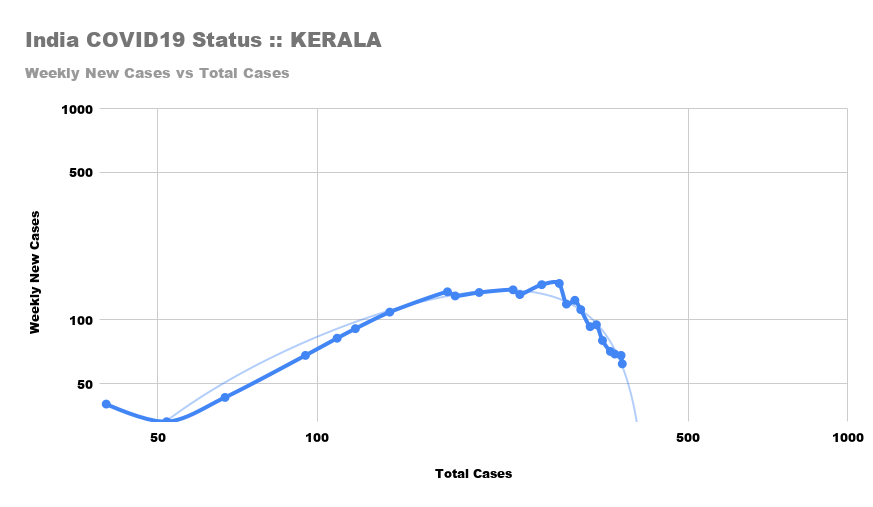
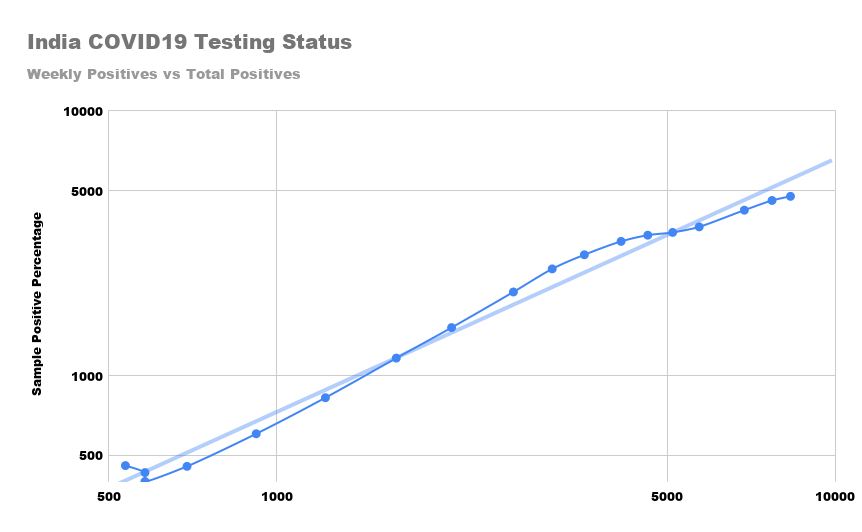
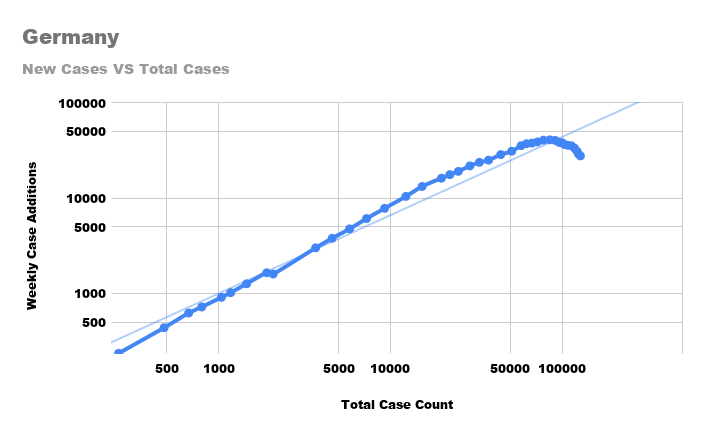
A good indicator - completely agnostic to country specifics is a Log-Log plot of weekly new cases (Y axis) verus total case count (X axis). There's supposed to be a math relationship here which we can ignore. The visual is a straight line during infection EXP growth.

13/n
So, here's the chart for India with a similar chart for the weekly test positives versus Total test positives.

Now, which is driving or shaping which? Hard to tell? It shouldn't be. If we were testing enough.

#COVID19India
14/n
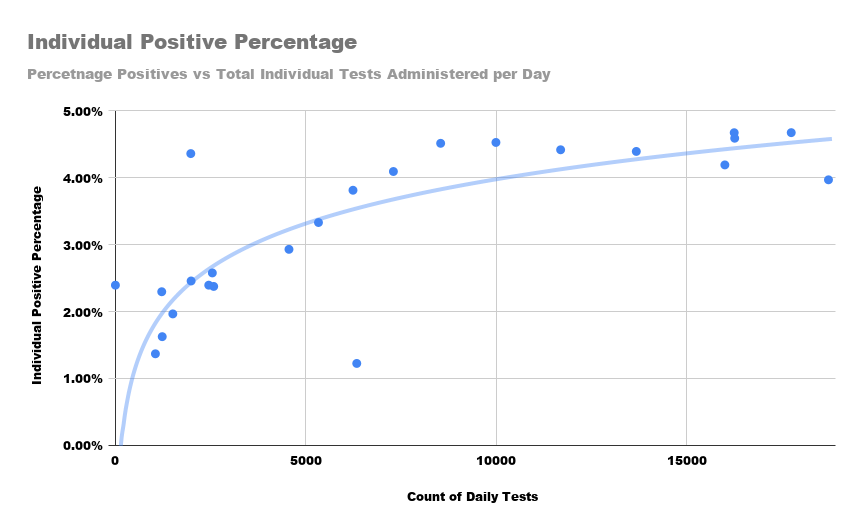
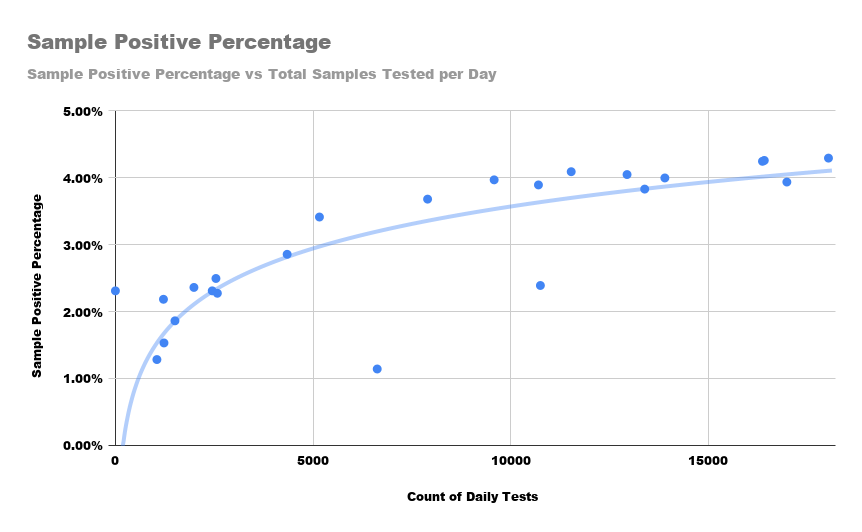
Another judgement criterion follows from the simple principle that IF we were testing enough, the positives rates should saturate with testing scale/capacity expansion. Do they? For #COVID19India?

Here's two graphs of % of test positives against # of daily tests.

15/n
Still not good enough?

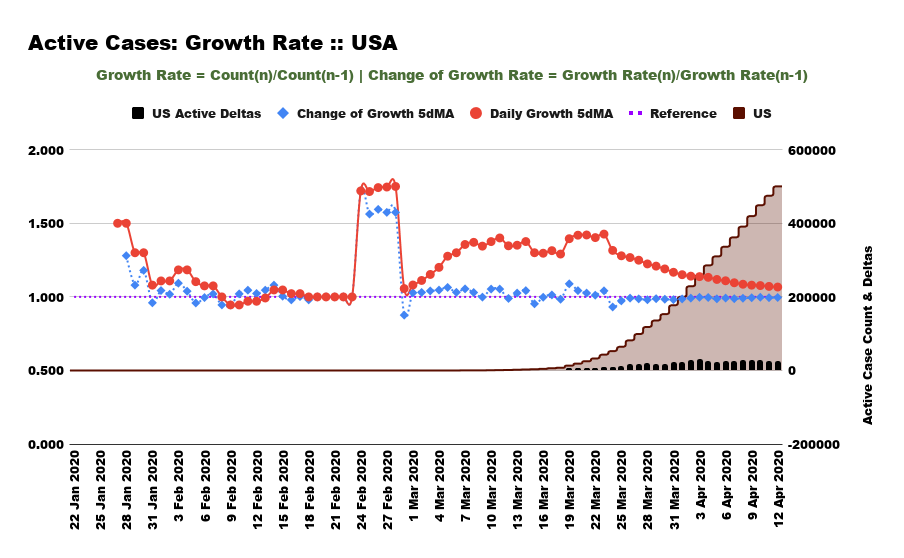
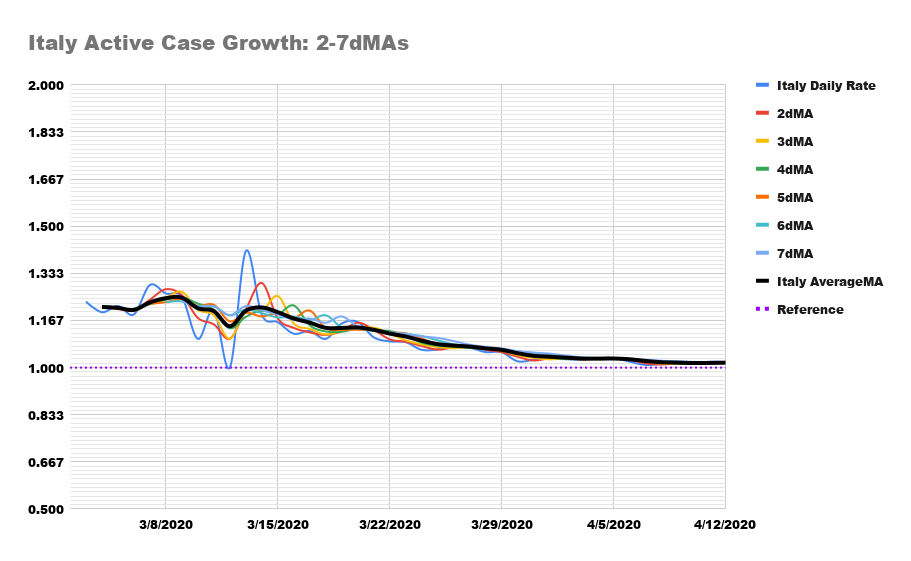
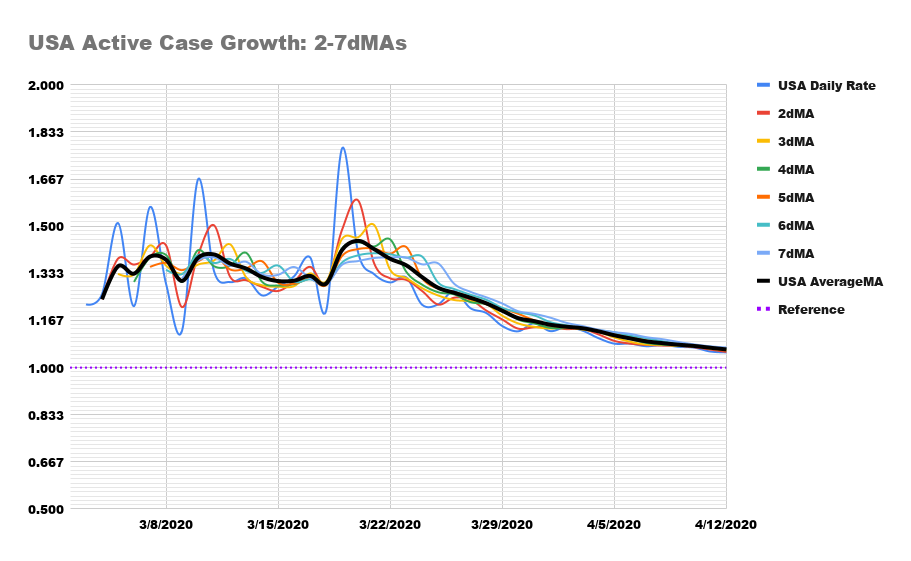
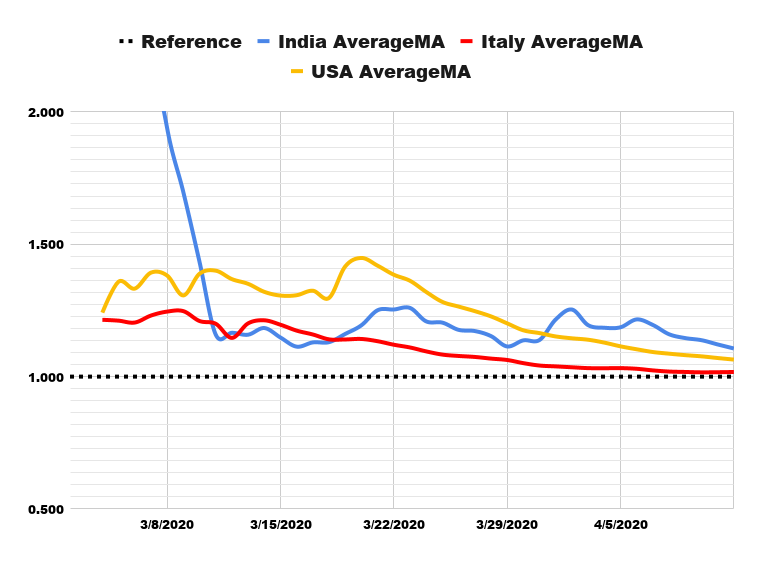
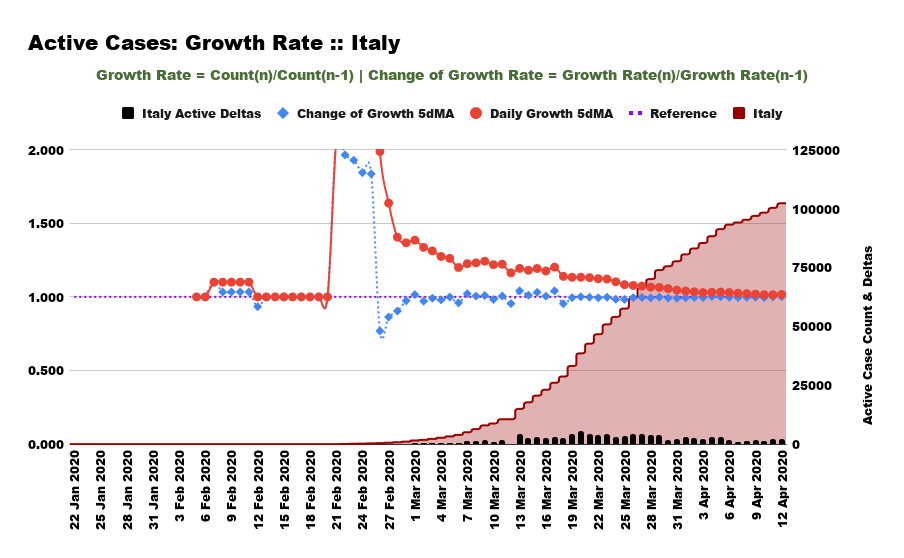
I also like to look at the convergence of different MAs and their consistent downtrend for a sustained length of time, to infer that some impact of NPIs is being felt on the infection spread.

This is what India looks like vs Italy and the US.

16/9
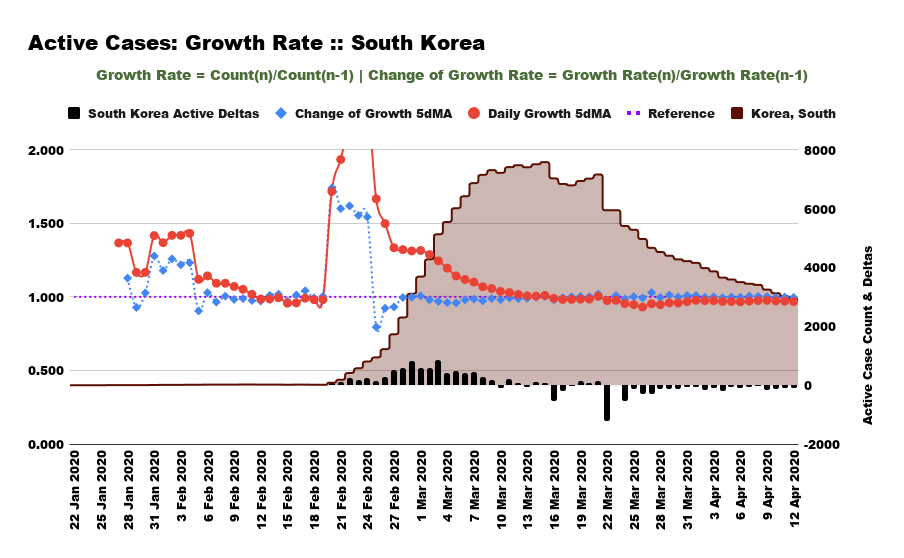
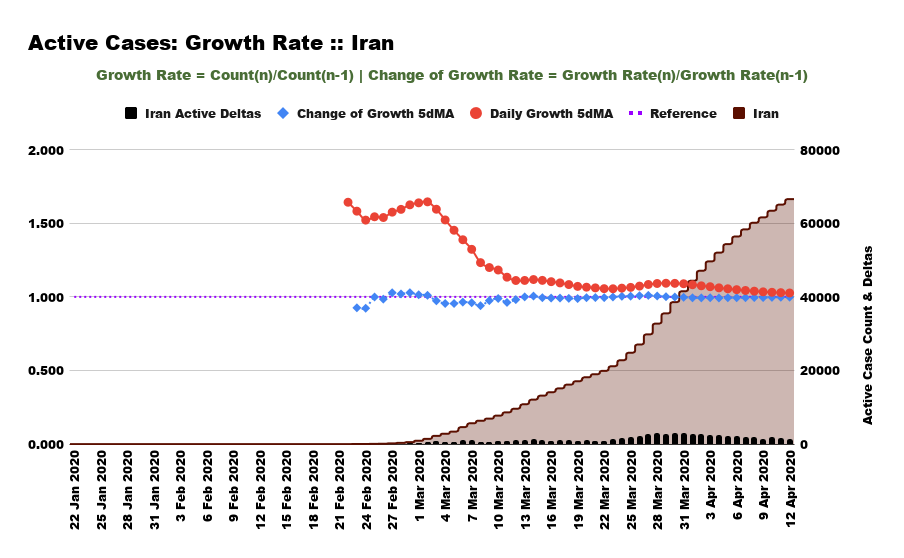
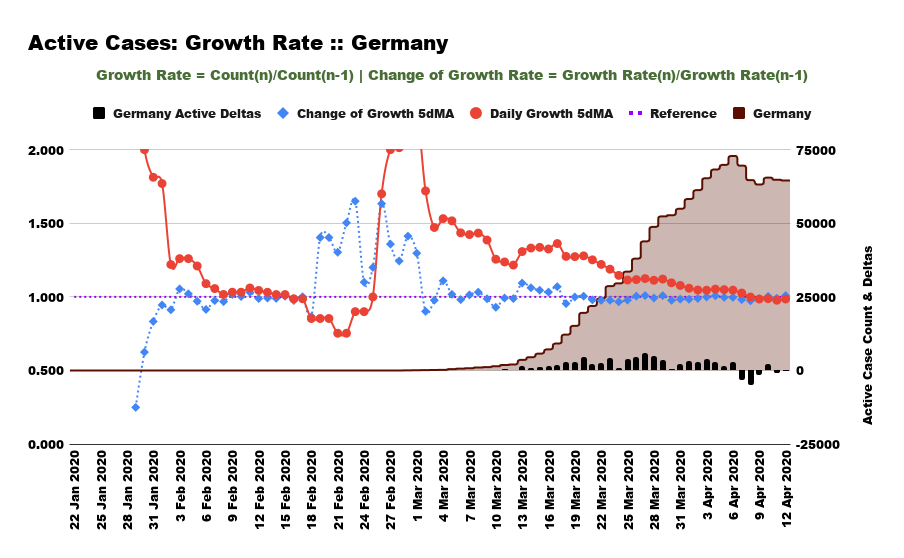
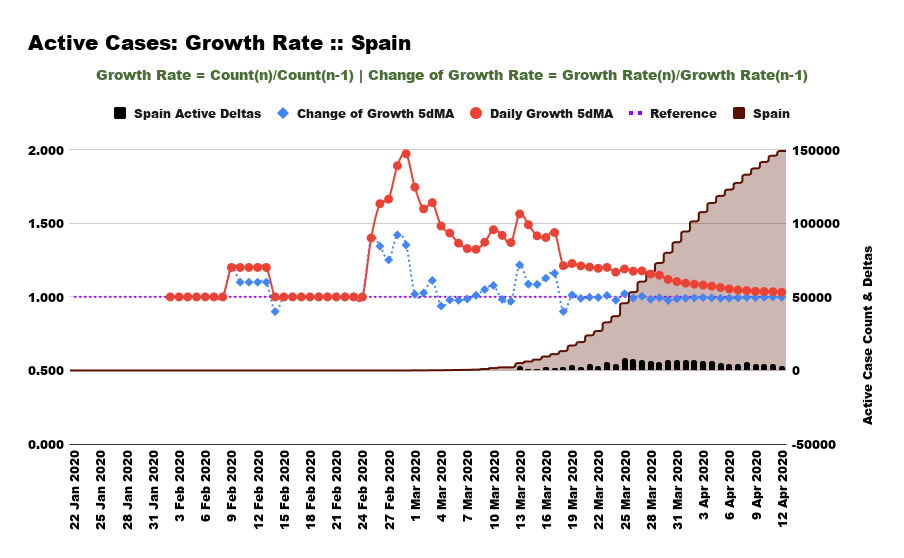
And those indicators reflect in these charts for comparison ...

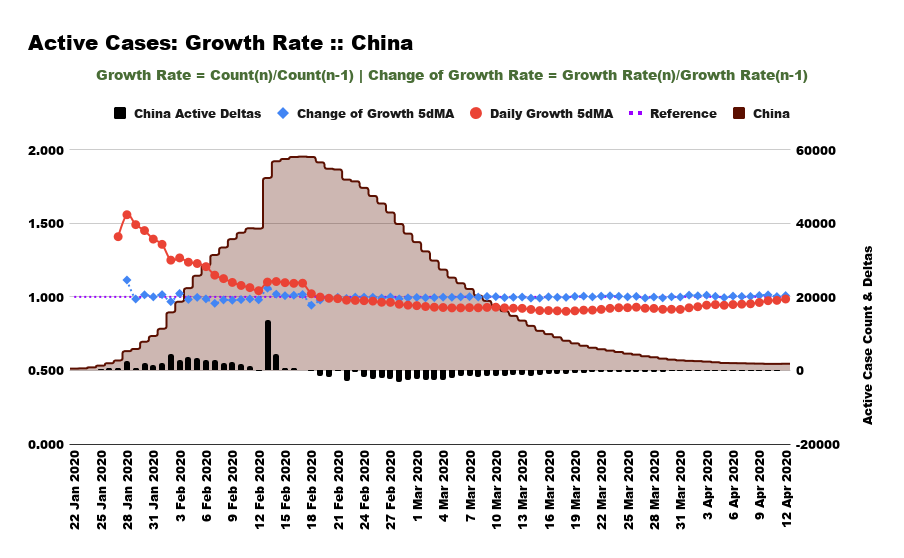
The little black bars at the bottom are the daily active case counts DIFFERENCES day-to-day. Flattening occurs when they turn negative. Like for South Korea.

#COVID19India #nCoV2019India
17/9
China sets a great standard here ...

Germany's doing it now. Spain and Iran are close.

The point is - we are nowhere close.

#coronavirusindia #COVID19India #nCoV2019India
18/9
To verify, take a look at the Log-Log plots for these countries ... AND The state of Kerala.

Unless the rest of the states of India do what Kerala is doing and HOW, this is a battle that WILL NOT BE WON. Kerala is also leading in extensive testing for #COVID19India ...

19/9
To close this off...

If the Q of how we're doing is so easily answered, it's likely a misjudged call. And if you're doing so off some "credentialled" or "influential" expert telling you so, you're likely being misled.

#StaySafe #StayHomeIndia
#COVID19India #nCoV2019India
20/20
Missing some Tweet in this thread? You can try to force a refresh.

Enjoying this thread?

Keep Current with G Raghuram

Profile picture

Stay in touch and get notified when new unrolls are available from this author!

Read all threads

This Thread may be Removed Anytime!

Twitter may remove this content at anytime, convert it as a PDF, save and print for later use!

Try unrolling a thread yourself!

how to unroll video

1) Follow Thread Reader App on Twitter so you can easily mention us!

2) Go to a Twitter thread (series of Tweets by the same owner) and mention us with a keyword "unroll" @threadreaderapp unroll

You can practice here first or read more on our help page!

Follow Us on Twitter!

Did Thread Reader help you today?

Support us! We are indie developers!


This site is made by just two indie developers on a laptop doing marketing, support and development! Read more about the story.

Become a Premium Member ($3.00/month or $30.00/year) and get exclusive features!

Become Premium

Too expensive? Make a small donation by buying us coffee ($5) or help with server cost ($10)

Donate via Paypal Become our Patreon

Thank you for your support!