NEW: Our 4/22 model release involves updated estimates for previously included locations in the US and Europe, and a more in-depth examination of the results.
We also have #COVID19 predictions for Puerto Rico and by province in Canada.
🆕healthdata.org/covid/updates
(Thread)
We also have #COVID19 predictions for Puerto Rico and by province in Canada.
🆕healthdata.org/covid/updates
(Thread)

As we add new locations to our production pipeline, we will focus on producing estimates for locations that have reported a minimum of 50 cumulative deaths to date.
For example, in today’s release we show results for four Canadian provinces (Alberta, British Columbia, Ontario, and Quebec) that have met the threshold, but not for other provinces. ➡️covid19.healthdata.org/projections
Further, we are pleased to announce that our updated manuscript, including up-to-date technical appendices, is now available online: healthdata.org/research-artic…
Our 4/22 update includes 3rd iteration of estimates of when states may be able to consider easing currently implemented social distancing policies if – and only if – strong containment measures already have been instituted. ➡️covid19.healthdata.org/projections
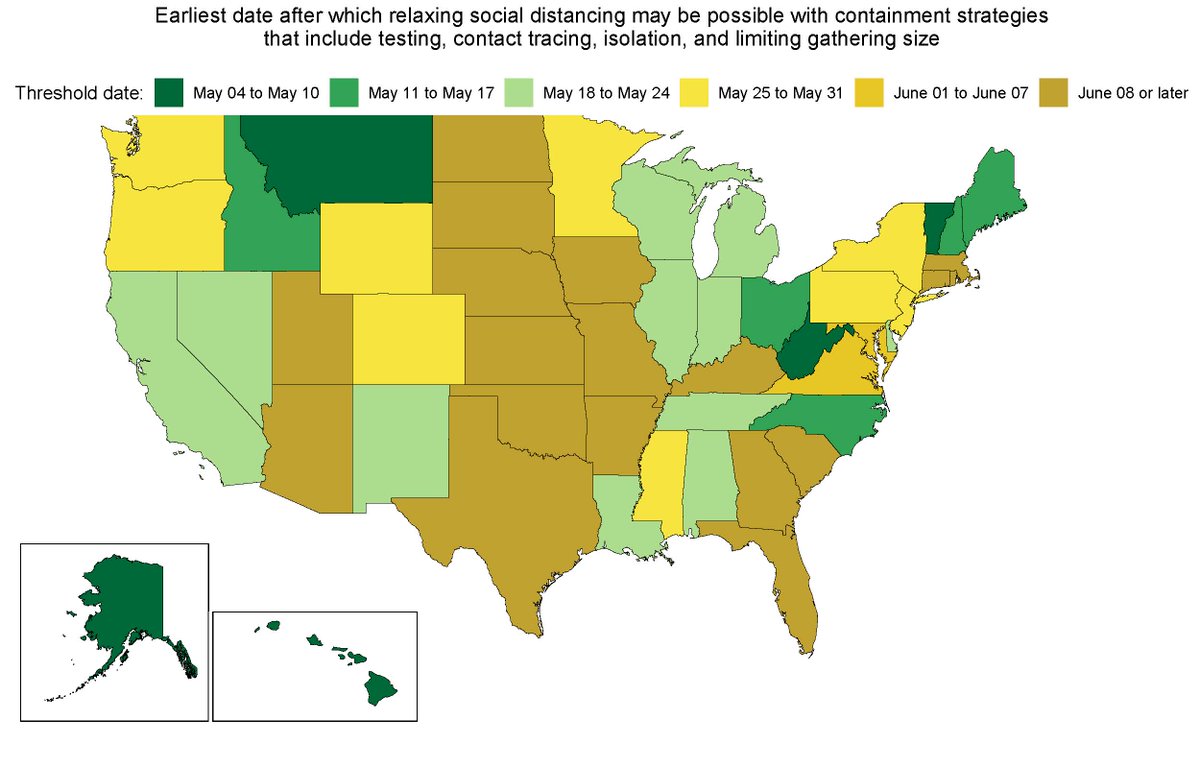
These estimated dates are based on projections of all-age #COVID19 prevalent infections – that is, all occurring infections in a location, not just new ones... (continued)
...and when these projections fall below 1 prevalent infection per 1,000,000 population for the upper bound of the 95% uncertainty interval.
This threshold is viewed as a conservative estimate of what locations could potentially identify via active case detection and contact tracing given available public health resources.
For some places, this may be an underestimate of public health capacity – in others, it could remain ambitious until containment efforts are scaled up. If or as such data become available, they can also be incorporated into the models.
Between our first release on April 17 and the release on April 21 on potential timing for easing distancing measures in the US, states shifted an average of 1.3 days later; the median, a metric less sensitive to outliers, was 0 days.
While the majority of states saw minor shifts in estimated dates over these releases, five states saw larger changes in their projected dates since our initial release on April 17:
◼️Washington
◼️Florida
◼️North Dakota
◼️Arizona
◼️Kansas
◼️Washington
◼️Florida
◼️North Dakota
◼️Arizona
◼️Kansas
*This prediction is based on when the upper bound of the 95% uncertainty interval for all-age COVID-19 prevalent infections falls below 1 per 1,000,000. To read more on this approach, please refer to our April 17 estimation update ➡️bit.ly/417Update
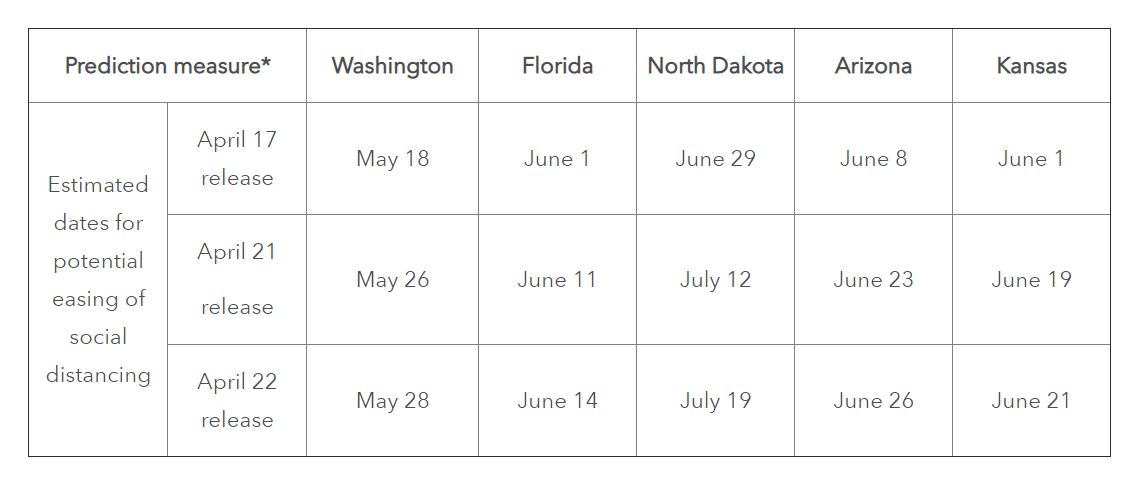
The exact reasons why the dates have shifted are unique to each state, but some shared characteristics are present. First, all five states now have higher cumulative COVID-19 death projections since the April 17 release.
The updated death model, which now uses COVID-19 cases as a leading indicator to predict epidemic peak and overall shape, has resulted in longer peaks and tails for many states.
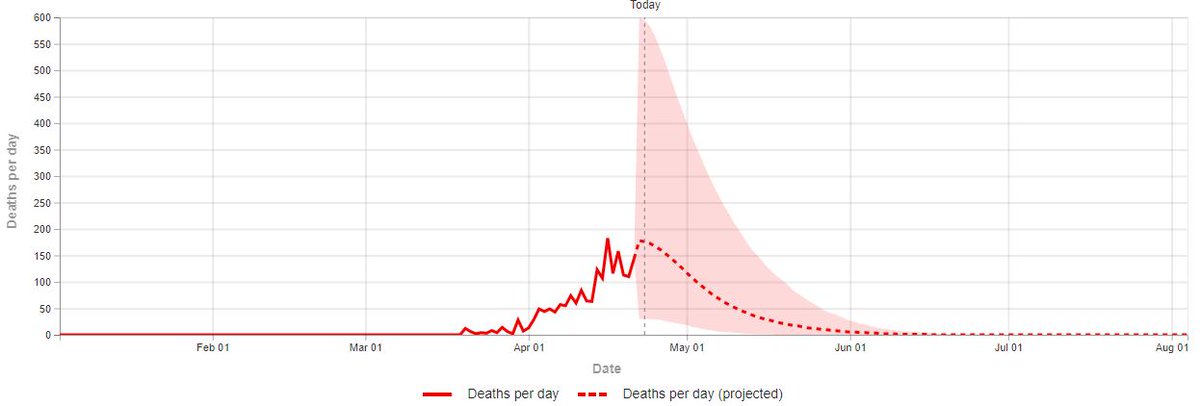
Except for North Dakota, these states appear to have already experienced peaks in daily COVID-19 deaths, but the duration and shapes of their downward trajectories are changing as updated data can be incorporated into the models.
For instance, in Washington state, an uptick in daily COVID-19 deaths captured in time series between the April 17 release (input data through April 16) and yesterday’s release (input data through April 20) increased the state’s total COVID-19 deaths to date by 30.
Subsequently, Washington’s descent from its epidemic peak is now slower than previously estimated – and thus the projected timing of potentially easing distancing measures is being pushed back further as well.
Importantly, the four other states had initial date predictions in June, a time period that is inherently less certain than estimates for May – especially when updated data inputs occur in terms of location-days.
As emphasized in our April 17 release, these projections could change as new data become available and/or different policies are implemented. This is particularly true for states with comparatively fewer COVID-19 deaths (for example, North Dakota, Kansas, Arizona).
Based on the latest available data, cumulative COVID-19 deaths could reach 4,544 (estimate range of 2,176 to 11,750) through the epidemic’s first wave in Canada.
Projections suggest that Ontario and Quebec could have the largest toll in Canada, at 1,953 (1,186 to 4,101) and 1,481 (761 to 3,629) cumulative COVID-19 deaths, respectively. Initial projections for Canada and provinces with 50 or more cumulative deaths are listed below.