"If we get this down to 20,000 & below, that's a good outcome”
We know how many #COVID19 deaths Vallance claimed he believed would be a good outcome
I can now reveal how many deaths SAGE believed would represent the best & worst scenarios👇#BreakingNews
We know how many #COVID19 deaths Vallance claimed he believed would be a good outcome
I can now reveal how many deaths SAGE believed would represent the best & worst scenarios👇#BreakingNews
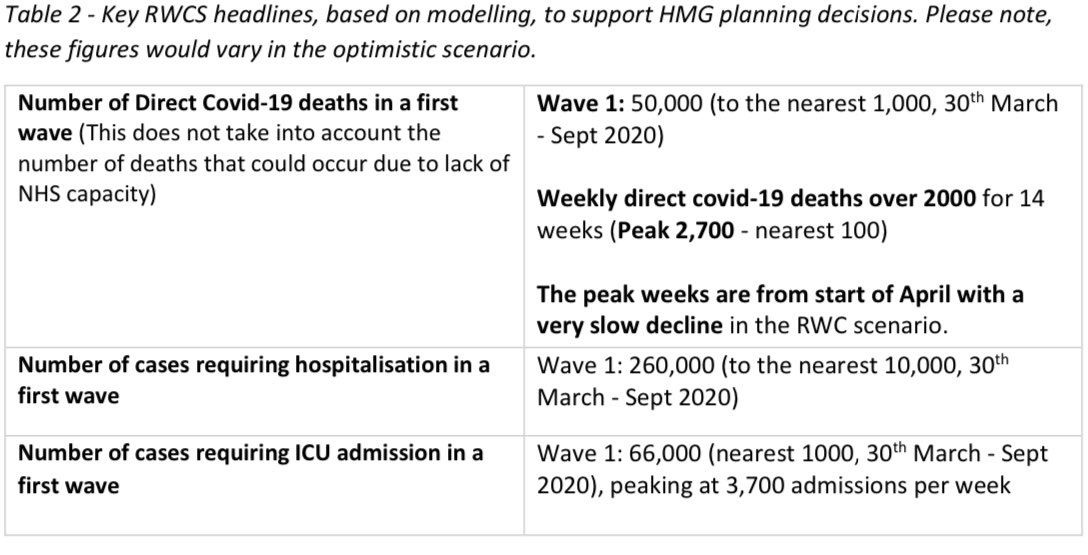
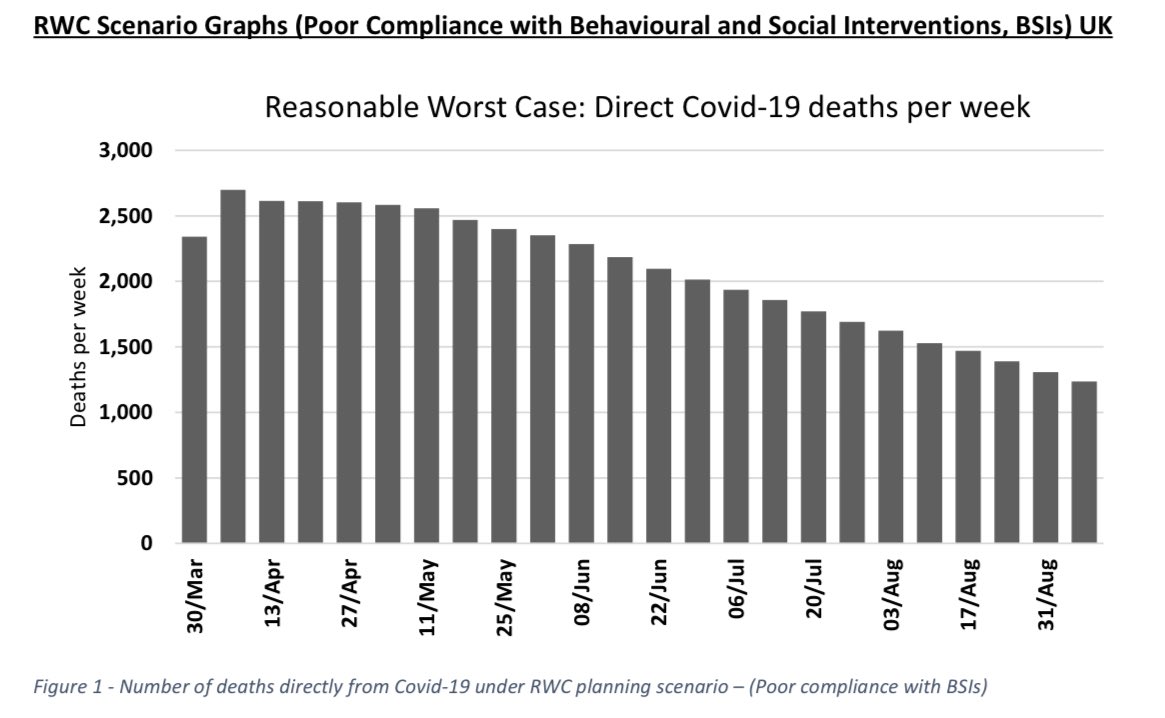
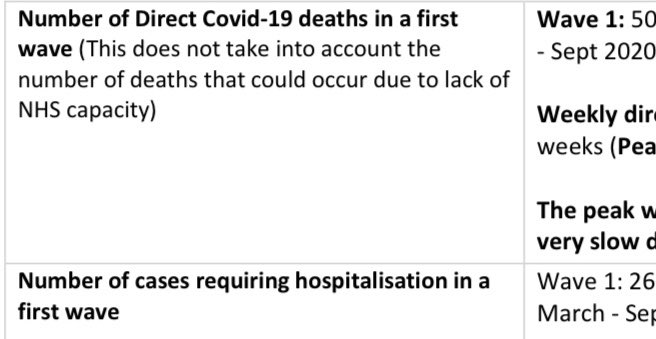
These newly released SAGE documents from 29 March, show that SAGE’S Reasonable Worst Case scenario had a maximum of 50,000 direct deaths between March & Sept.
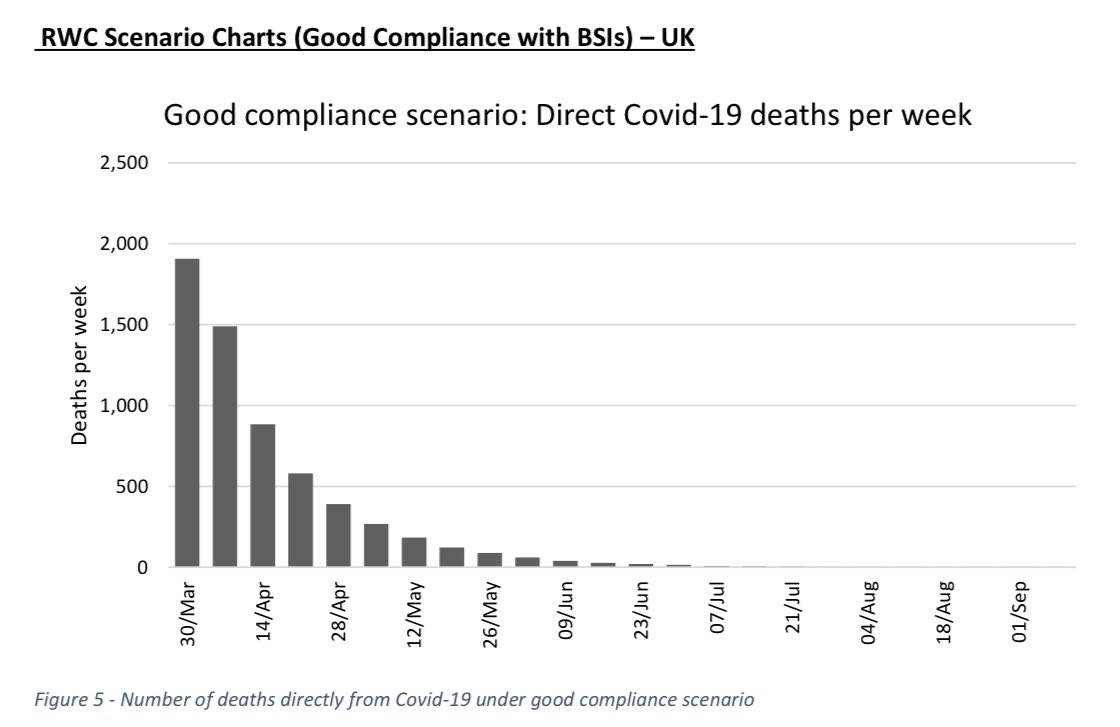
Their best scenario was 6,000.
We’ve already exceeded their worst scenario...& it’s only July! assets.publishing.service.gov.uk/government/upl…
Their best scenario was 6,000.
We’ve already exceeded their worst scenario...& it’s only July! assets.publishing.service.gov.uk/government/upl…
This SAGE document released tonight was produced on 27 March
Vallance's "20,000 deaths is a good outcome" comments were on 17 March
On 16 March, @neil_ferguson had warned 250,000 deaths without any action
If you'd like to understand the numbers, check👇
Vallance's "20,000 deaths is a good outcome" comments were on 17 March
On 16 March, @neil_ferguson had warned 250,000 deaths without any action
If you'd like to understand the numbers, check👇
If you want to skip the backstory (for now) the important thing to remember is that 250,000 was the unmitigated death toll.
A mitigation strategy (otherwise known as #HerdImmunity) would require limited lockdown so as not to not to overwhelm the NHS.
This document explains it.
A mitigation strategy (otherwise known as #HerdImmunity) would require limited lockdown so as not to not to overwhelm the NHS.
This document explains it.
The modelling that supports the 50,000 figure only appears to be hospital deaths.
This means care home & home deaths were not considered.
Were the modellers told a “protective ring” would be thrown around care homes & they could be excluded from models?
This means care home & home deaths were not considered.
Were the modellers told a “protective ring” would be thrown around care homes & they could be excluded from models?
This document therefore becomes central to the #CareHomeScandal (explored in the THREAD👆).
Did the govt really think care homes would be shielded?
Is it possible they didn’t mind if the modellers to "got it wrong"?
An answer is also perhaps contained in the same document.👇
Did the govt really think care homes would be shielded?
Is it possible they didn’t mind if the modellers to "got it wrong"?
An answer is also perhaps contained in the same document.👇
The document also has information about ICU capacity.
In the worst case, it shows the govt had timed the measures to be just in time to prevent ICU capacity being overwhelmed (approx surge capacity was 5,000).
The graph shows modelling of ICU being just below 5,000 throughout.
In the worst case, it shows the govt had timed the measures to be just in time to prevent ICU capacity being overwhelmed (approx surge capacity was 5,000).
The graph shows modelling of ICU being just below 5,000 throughout.

This 5,000 capacity (which doesn’t include the Nightingale Hospitals) was made possible by the evacuation of hospital elderly patients to care homes.
But the transfer of patients from hospitals to care homes without #COVID19 tests was already govt policy.
But the transfer of patients from hospitals to care homes without #COVID19 tests was already govt policy.
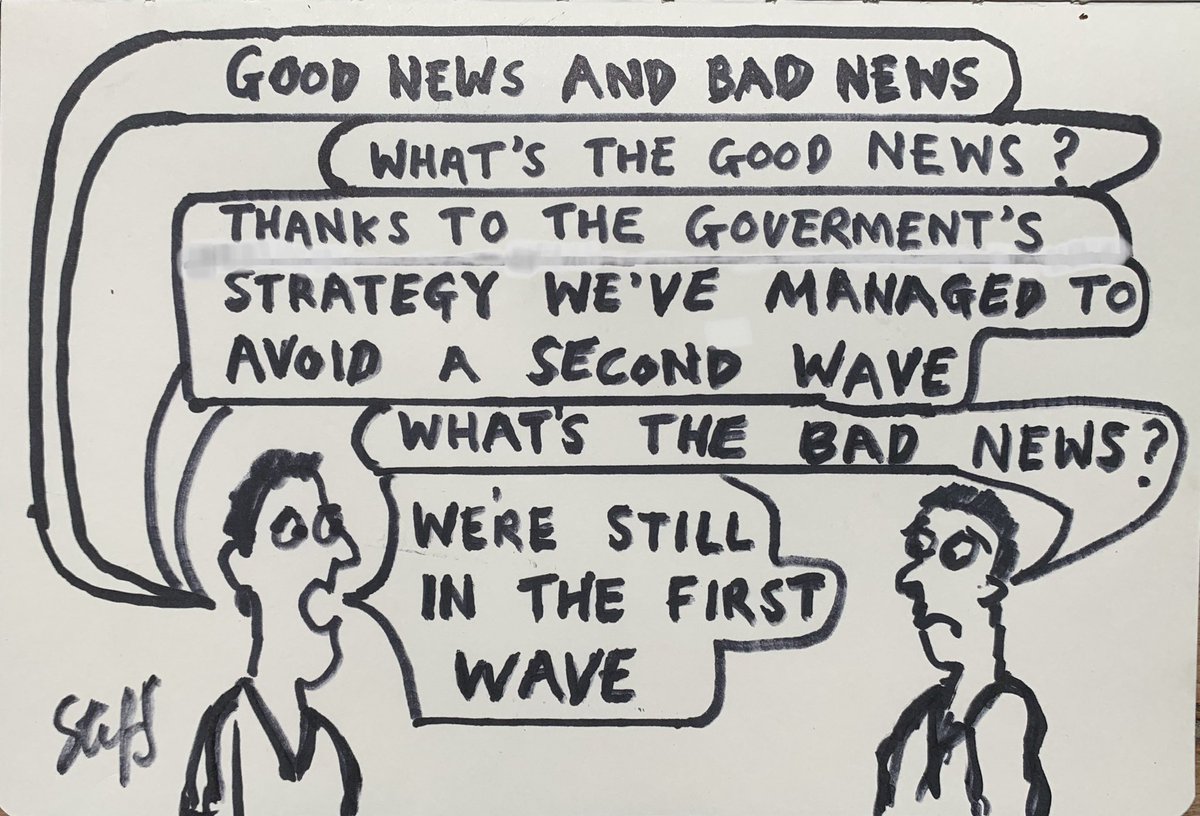
The document refers to these figures as the “First Wave” or “Wave 1”.
This means - despite the PM’s talk of “sending the virus packing” & “turning the tide in 12 weeks” - the govt have always been planning for more waves.
It is vital we see their modelling for future waves.
This means - despite the PM’s talk of “sending the virus packing” & “turning the tide in 12 weeks” - the govt have always been planning for more waves.
It is vital we see their modelling for future waves.
A govt failure was not to do modelling for lockdown until mid-March.
On 5/5 @Jeremy_Hunt asked Vallance if they “decided not to model what death rates would be with track & trace model b/c you didn’t have testing capacity?”
“I can't remember” he replied.
On 5/5 @Jeremy_Hunt asked Vallance if they “decided not to model what death rates would be with track & trace model b/c you didn’t have testing capacity?”
“I can't remember” he replied.
Another key failure was not sharing their modelling transparently or to include Public Health experts around the top table.
But lessons haven’t been learned.
The govt must show us their predictions for the 2nd/3rd waves & must widen SAGE participation.
But lessons haven’t been learned.
The govt must show us their predictions for the 2nd/3rd waves & must widen SAGE participation.
As @devisridhar points out the govt STILL won’t say what their objective is.
"Is the objective still to let #coronavirus flow through the population & just to stay within NHS capacity?" she asks.
This document it reveals it is: #HerdImmunity strategy.
"Is the objective still to let #coronavirus flow through the population & just to stay within NHS capacity?" she asks.
This document it reveals it is: #HerdImmunity strategy.
SAGE estimated there would be no #COVID19 deaths by July 7 if there was good compliance by the public (i.e. 75% of families adhering to household quarantine & 70% of symptomatic cases self-isolating).
In reality about 70% of Britons followed the rules. dailymail.co.uk/news/article-8…
In reality about 70% of Britons followed the rules. dailymail.co.uk/news/article-8…
It is unimaginable that the govt & SAGE haven’t got models & strategies for the future. This saw-tooth graph shows the Dutch model of “yo-yo” lockdowns ‘til 2022.
Like UK, Netherlands are also pursuing a #HerdImmunity strategy, also called “mitigation”.👇
Like UK, Netherlands are also pursuing a #HerdImmunity strategy, also called “mitigation”.👇
1) Why were care home deaths not in the modelling?
2) Does fact lockdown measures were timed to prevent ICU capacity being overwhelmed explain delay btw 16 - 23 March. They wanted infections but not too many.
3) Where’s the modelling for the next waves?
thenational.scot/news/18561422.…
2) Does fact lockdown measures were timed to prevent ICU capacity being overwhelmed explain delay btw 16 - 23 March. They wanted infections but not too many.
3) Where’s the modelling for the next waves?
thenational.scot/news/18561422.…
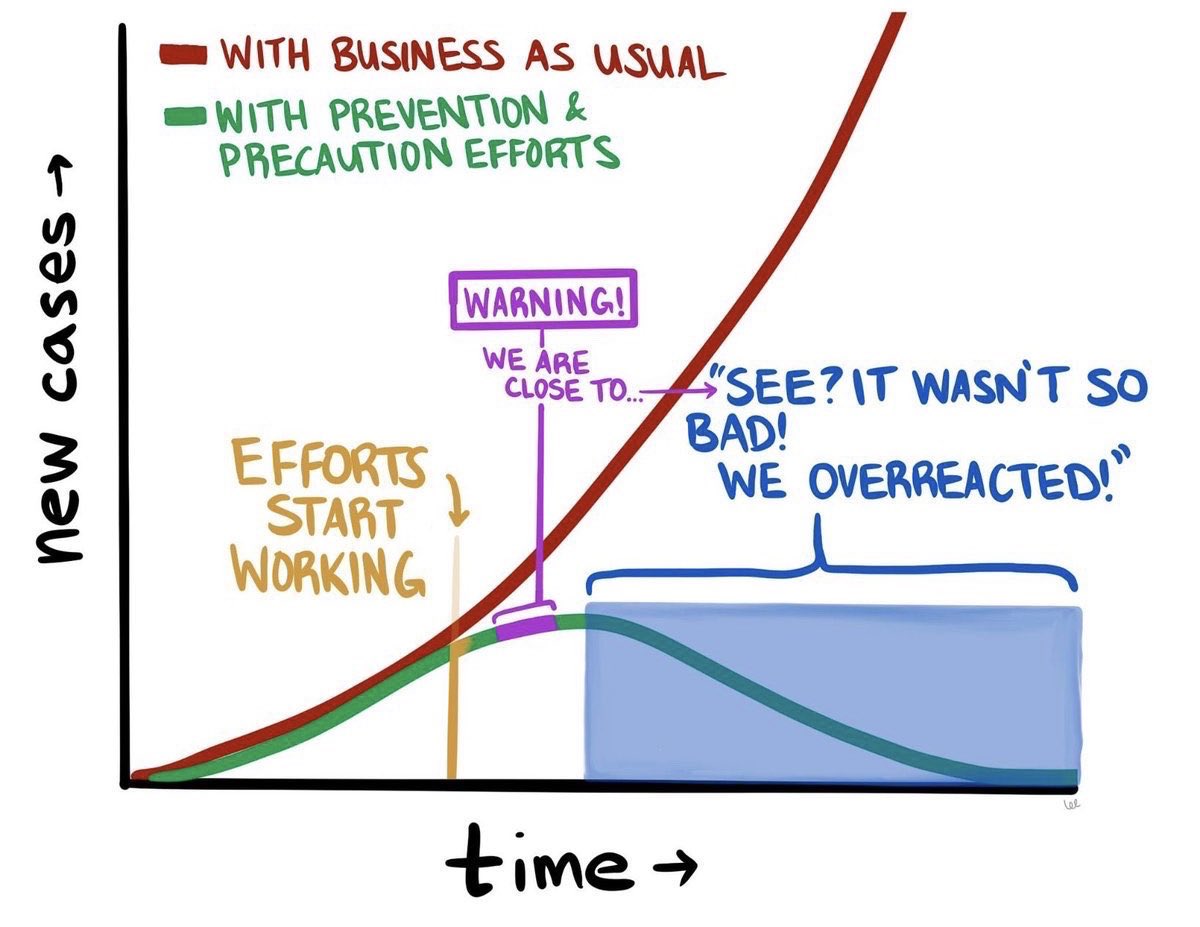
Updated graphic which explains why the government’s decision to lift lockdown when infections, deaths & the R rate are still so high, makes perfect sense as part of their #HerdImmunity strategy. Let the virus spread.
#HerdImmunityScandal #COVID19 #SuperSaturday #PubsOpening
#HerdImmunityScandal #COVID19 #SuperSaturday #PubsOpening