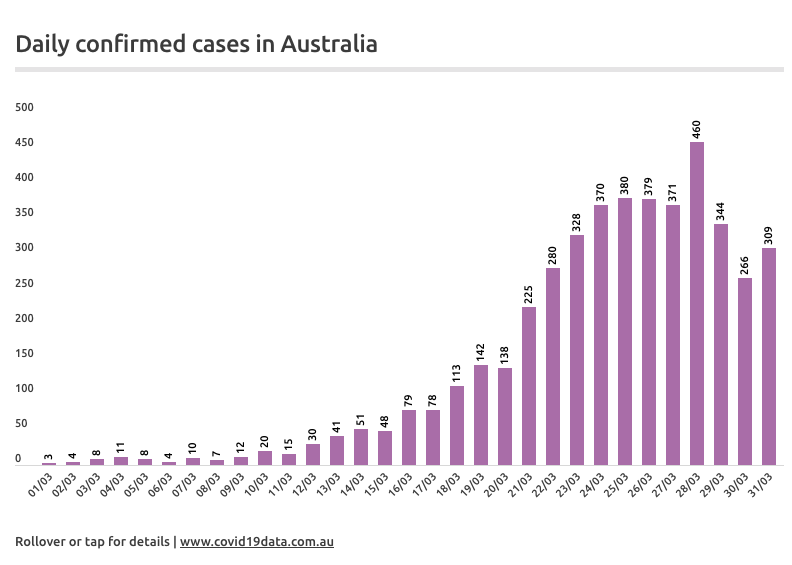
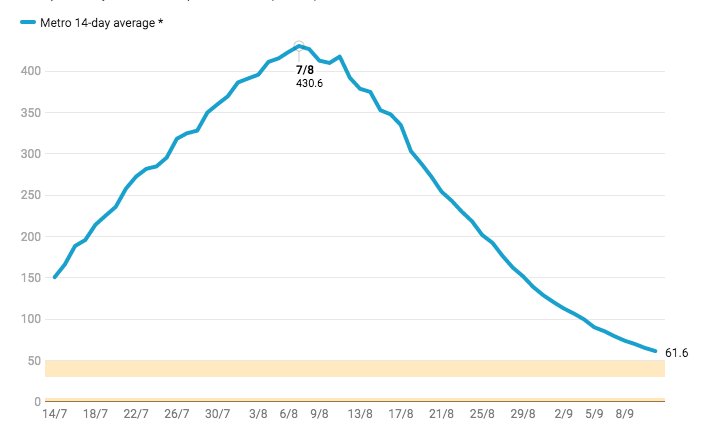
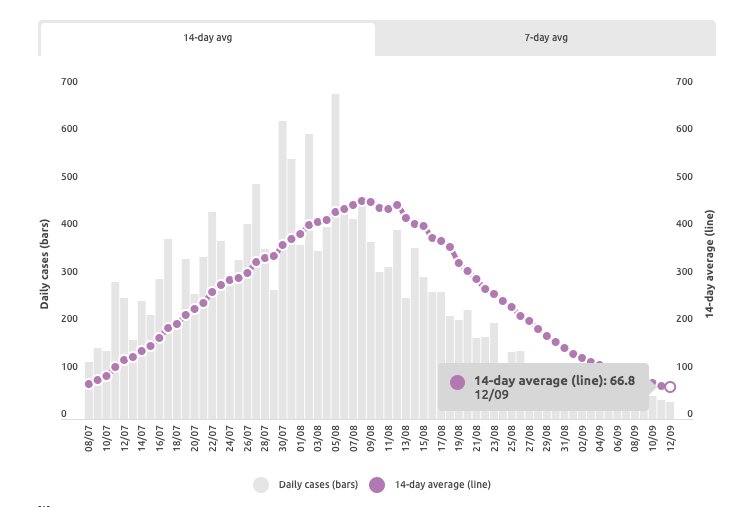
We finally have the history of the 14-day avg for metro and regional #CovidVic .

Now we can see the curve. Think it rose quickly? It appears to have fallen even faster. Really started to fall away three weeks ago. Frustrating shallowing now. Keep going Vic!

#COVID19Vic
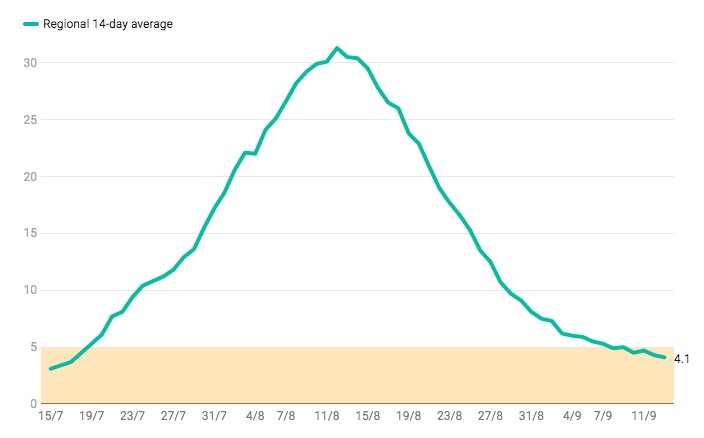
Here it is for regional. The 14-day avg peaked at 31.3 cases / day one month ago.

(Data note - we had to wait for @VicGovDHHS to provide all this b/c the raw data aren't published. Big thanks to @migga @covidliveau for passing it onto me! <3 )
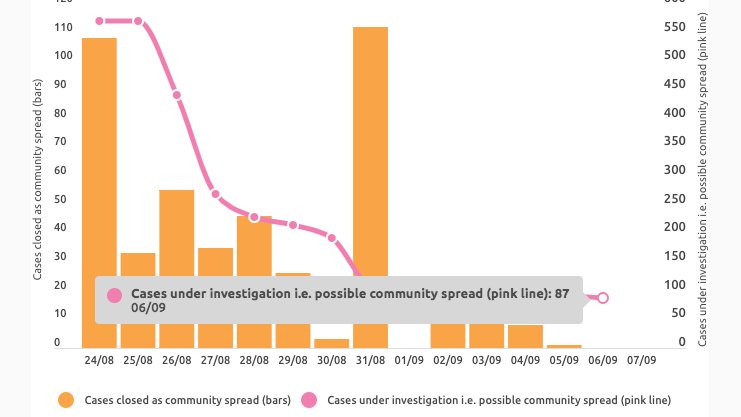
3/5. Here is the other key roadmap trigger - total number of cases with an unknown source in the last two weeks. (Note these figures are delayed by a few days). Metro goal = 5. Regional goal = 0.
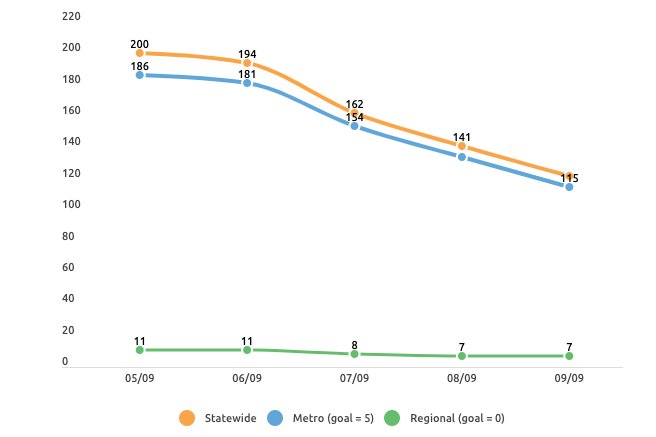
Statewide 14-day average = 66.8/day (based on true daily cases; not net).
Live charts here:
covid19data.com.au/victoria
Update: Regional Victoria now at 4.1 in 14-day avg.
All key triggers updated for Sunday.

• • •

Missing some Tweet in this thread? You can try to force a refresh
 

Keep Current with Juliette O'Brien

Juliette O'Brien Profile picture

Stay in touch and get notified when new unrolls are available from this author!

Read all threads

This Thread may be Removed Anytime!

PDF

Twitter may remove this content at anytime! Save it as PDF for later use!

Try unrolling a thread yourself!

how to unroll video
  1. Follow @ThreadReaderApp to mention us!

  2. From a Twitter thread mention us with a keyword "unroll"
@threadreaderapp unroll

Practice here first or read more on our help page!

More from @juliette_io

6 Sep
Charts tracking trigger points in Victoria's roadmap to recovery: (thread, 1/5).

1. Avg daily cases in metro Melbourne. Goal: blue line to reach gold band (30-50 / day, 14-day trailing avg).

#COVID19Victoria #COVID19Vic #COVID19Aus #COVID19
2. Avg. daily cases in regional Victoria. Goal: green line going for gold. (<5 / day, 14-day trailing avg).
3. Community spread (orange) + still under investigation (pink line).

*Metro Step 2 contingent on these*. Metro Step 3 may start with <5 unknowns in last 2 weeks. Regional Step 3 may start with 0 unknowns in regional VIC (tho geo data re community spread not provided).
Read 10 tweets
19 Apr
Here's a wrap of some of the key charts on covid19data.com.au right now.

1/8 - Reported recoveries (yellow) and deaths (blue) as a proportion of confirmed cases to give a timeline view of 'open' cases (black) | covid19data.com.au
#covid19australia #Covid_19australia
2/8 - The site now has charts for tests / day (national and state / territories ) but this analysis compares 5-day average of tests (pink bars) with new confirmed cases (black line) |
covid19data.com.au/testing
3/8 - The daily confirmed cases each day is the key graph atm.
Read 9 tweets
3 Apr
Thread. I spent last night looking at Australia's #COVIDー19 testing data🦉Especially after we heard the PM say Australia has one of the highest testing rates in the world. True? 1/10
covid19data.com.au
#COVID19au #covid19australia #coronavirusau #auspol
I pulled some testing data from other countries. There are a stack of caveats here b/c of the different ways countries test and report, but here's what I found ... 2/10
We all know South Korea (blue line) is the gold standard - expansive and consistent. Germany (brown line) is another leader now. And the USA (green line) has a lot of patchy data but is in the midst of a massive push. (UK is lower - more on that another time). 3/10
Read 11 tweets
31 Mar
Thread. 1/12. Let’s talk about transmission sources. The growth of #COVID19 in Australia appears to have slowed with fewer confirmed cases announced for the last 3 days (yes, let's talk testing and 3-day averages soon).

#COVID19au #Covid_19australia
2/12. Today was just over 2 weeks since the fed govt announced travellers arriving in Aus had to self-isolate for 14 days. And it was about 1.5 weeks since borders closed to non-residents and non-citizens. So we’re probably seeing these policies start to bite. #auspol
3/12. So the question is - how many of the new confirmed cases each day are linked to OS-travel, and how many are community transmissions?
Read 17 tweets
25 Mar
Thread. One of the first notable things we saw after collecting / visualising #Covid_19australia cases was this chart showing travellers from USA brought the most #COVID_19 cases into Aus (below). Today I added cruise ships to that chart and this is what happened ... Image
The purple line is cases linked to cruise ships. It dwarfs any other region.
Caveat: many govts have stopped releasing travel details of cases so data re countries isn't complete and exacerbates the difference. But I believe still worth sharing as hints at the scale of the issue. Image
We've just heard a 69-year-old man in Toowoomba QLD has died after contracting COVID-19 on board a Royal Caribbean cruise ship. Feeling acutely aware of the people and families these numbers represent right now and sending deepest condolences to his family😓
Read 4 tweets
21 Mar
Thread. (Warning: this goes into the weeds but see 3, 5, 8 for key takeaways).
1/10
Confusion today about NSW #COVID_19 numbers. Here's why🧐. What they announced in the last 48 hours:
- Thurs 19 March: media release. "As at 11am today”. +40 cases, total 307.
#covid19australia
2/10
- Fri 20 March: press conference w/ Brad Hazzard, Dr Kerry Chant at 1pm. +75 cases, total 382. (citation @SMH live blog).
- Fri 20 March: media release. “As at 8pm today”. +46 cases, total 353 🤔
- Sat 21 March: media release. “As at 8pm today”. +83 cases, total 436.
3/10
So for some reason, NSW Health has reported an extra 29 cases today, that the minister had already reported y’day.

This led to covid19data.com.au briefly showing more cases than the official total. This has been corrected to match NSW Health's total figure.
Read 11 tweets

Did Thread Reader help you today?

Support us! We are indie developers!


This site is made by just two indie developers on a laptop doing marketing, support and development! Read more about the story.

Become a Premium Member ($3/month or $30/year) and get exclusive features!

Become Premium

Too expensive? Make a small donation by buying us coffee ($5) or help with server cost ($10)

Donate via Paypal Become our Patreon

Thank you for your support!

Follow Us on Twitter!