1/ New #bitcoin addresses were absolutely off the charts last week.
The backstory is bullish and intriguing — a unique view on a new bull market catalyst.
I’m about to break this down 👇
#BTC
The backstory is bullish and intriguing — a unique view on a new bull market catalyst.
I’m about to break this down 👇
#BTC
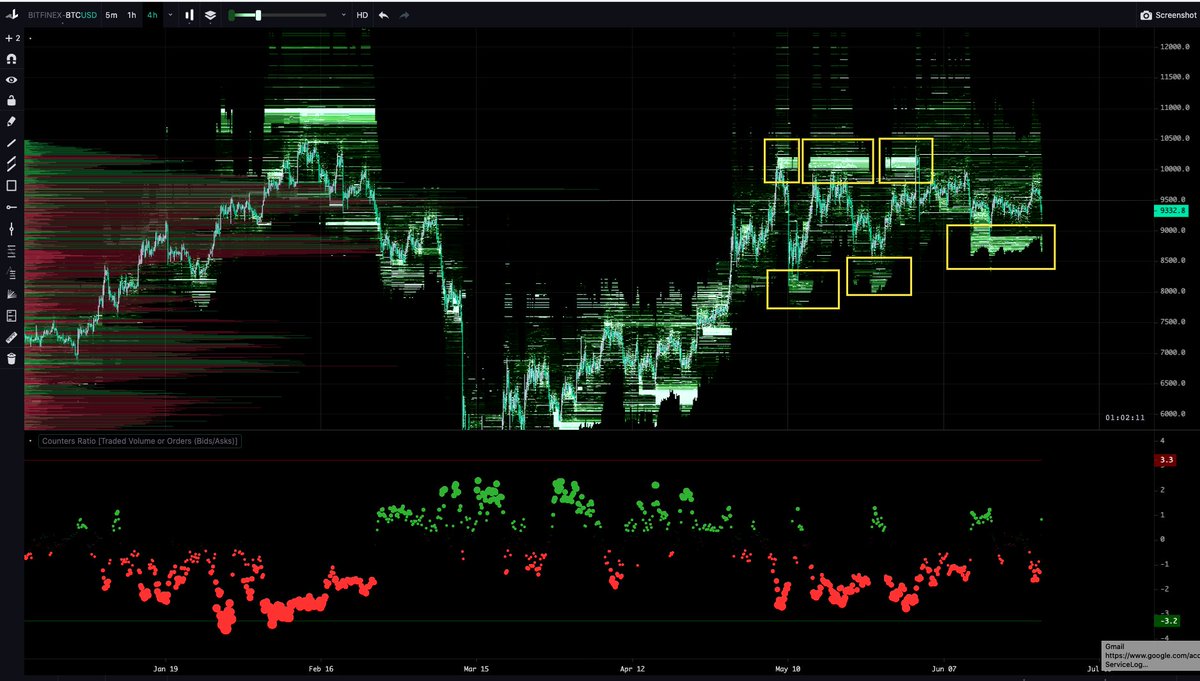
2/ First: volume precedes price.
And #bitcoin active address counts are an OG on-chain leading indicator of volume.
And #bitcoin active address counts are an OG on-chain leading indicator of volume.
https://mobile.twitter.com/woonomic/status/1311259900517867520
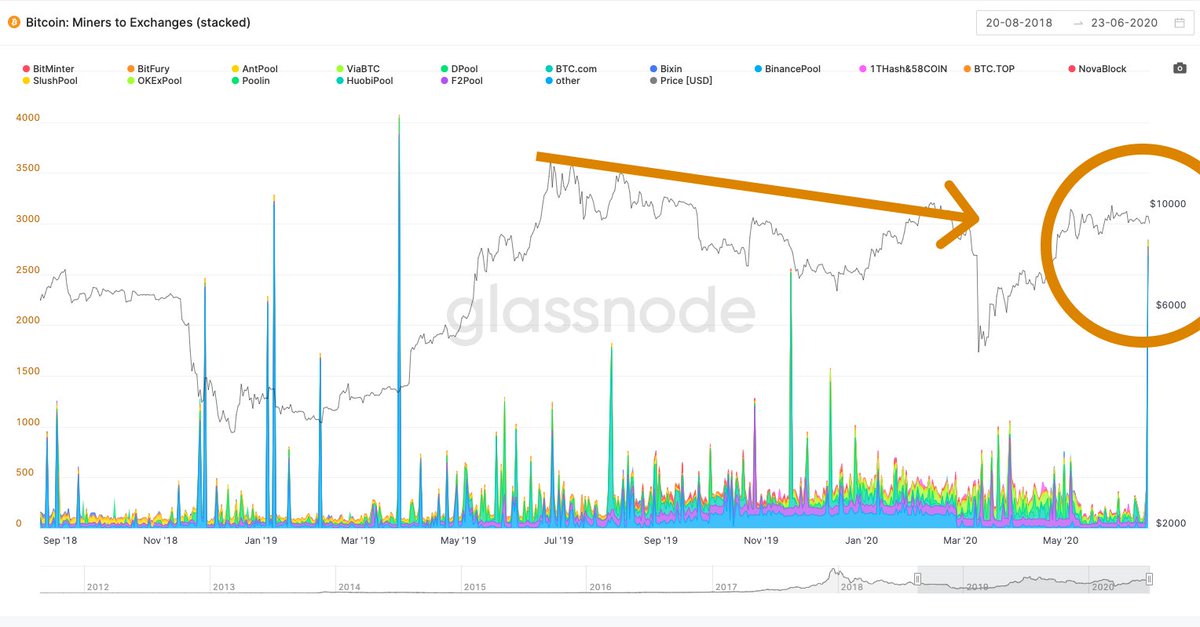
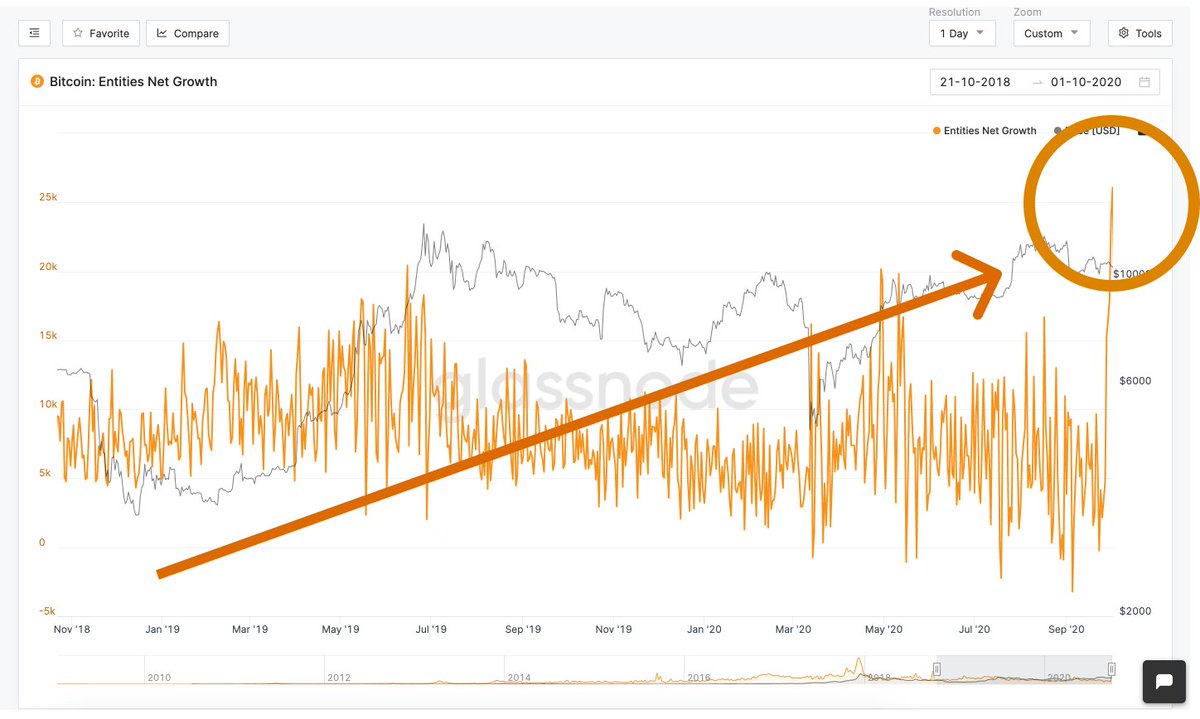
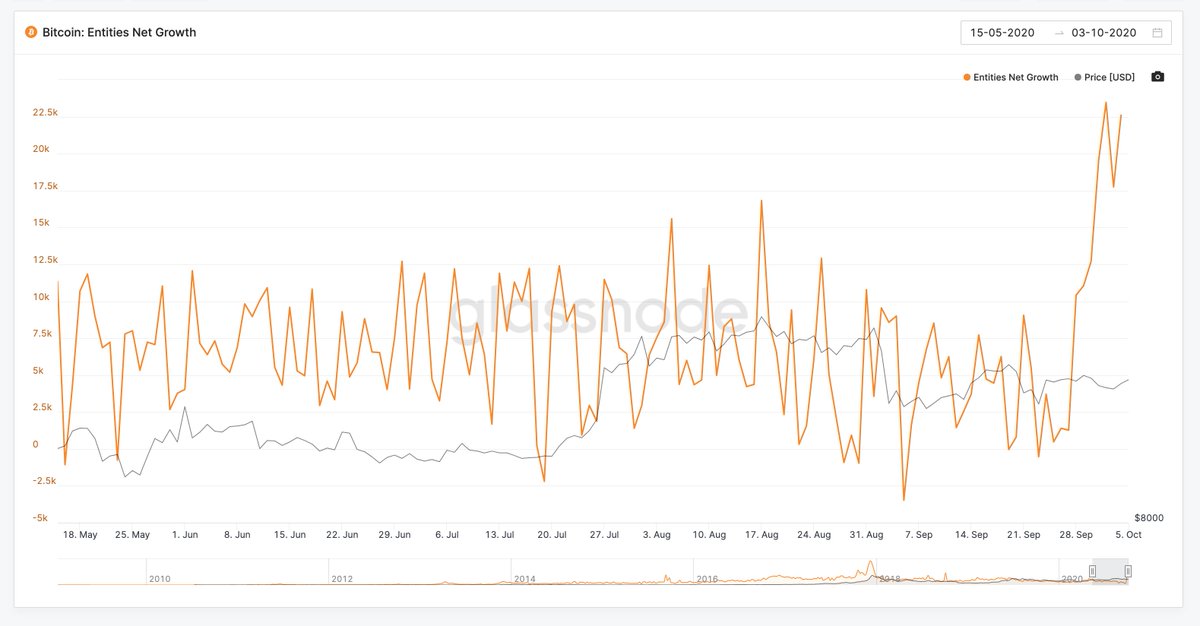
3/ We typically see 5-10k new #bitcoin addresses / day.
That figure grew it its highest level in over two years last week, peaking above 22k.
data // @glassnode // indispensable
That figure grew it its highest level in over two years last week, peaking above 22k.
data // @glassnode // indispensable
4/ Where are these new #bitcoin addresses coming from?
We’ll never know for sure — but here's my suspicion:
It's a story from last week that mostly passed under the radar — despite being the most bullish force I can imagine.
We’ll never know for sure — but here's my suspicion:
It's a story from last week that mostly passed under the radar — despite being the most bullish force I can imagine.
5/ Last week the Chinese government began a coordinated marketing campaign to focus Chinese retail investor psyche on crypto.
Yes, this is really happening.
coindesk.com/china-crypto-b…
Yes, this is really happening.
coindesk.com/china-crypto-b…
7/ The Chinese government seems to want to ignite the bull market.
https://mobile.twitter.com/cz_binance/status/1309373959410864129
8/ But doesn’t China have a long track record of suppressing crypto?
Yes...but the reality is more complex. Simplified:
Chinese leadership promotes whatever narrative benefits their position, at any given time.
Yes...but the reality is more complex. Simplified:
Chinese leadership promotes whatever narrative benefits their position, at any given time.
9/ Why the new narrative? My guess:
China dominates $BTC mining — and no doubt holds more $BTC than any other country, by a wide margin.
#Bitcoin is China’s national treasure.
Sooner or later, maximizing $BTC's potential becomes an unavoidable economic incentive.
China dominates $BTC mining — and no doubt holds more $BTC than any other country, by a wide margin.
#Bitcoin is China’s national treasure.
Sooner or later, maximizing $BTC's potential becomes an unavoidable economic incentive.
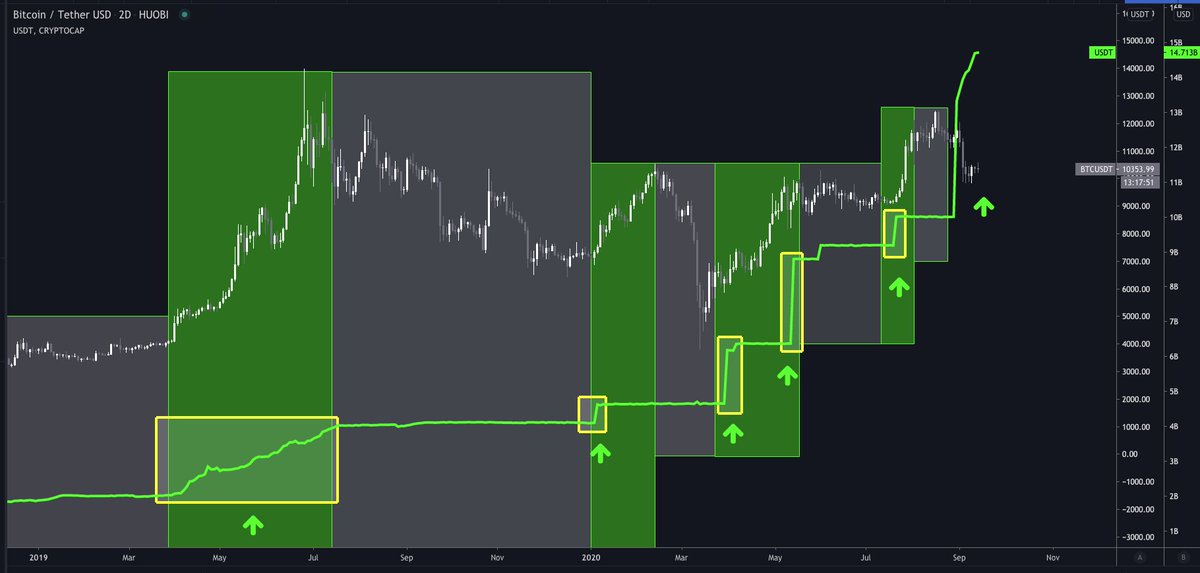
10/ The recent explosion in #Tether printing might have been a leading precursor to China's marketing campaign.
China dominates $USDT volume globally -- and #Tether dominates their fiat onramp liquidity.
China dominates $USDT volume globally -- and #Tether dominates their fiat onramp liquidity.
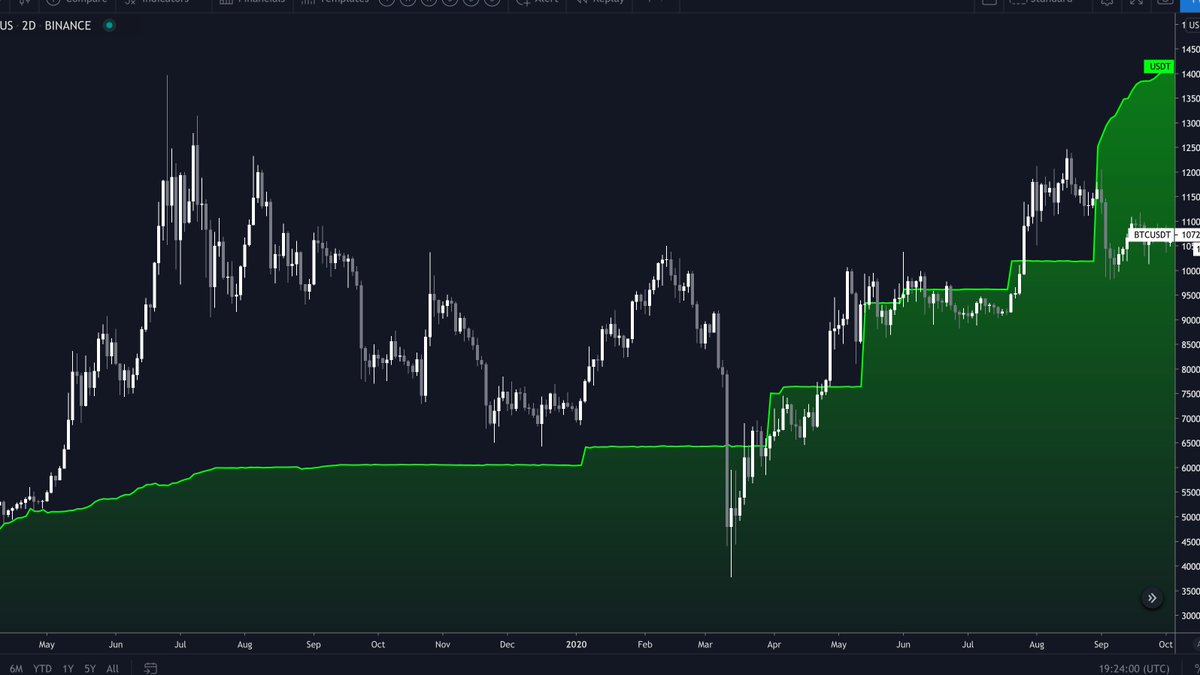
11/ And of course, #Tether printing has been an effective leading indicator for years.
h/t @BTC_JackSparrow
h/t @BTC_JackSparrow
12/ I suspect Chinese retail buying interest helped #bitcoin absorb last week’s bearish headlines.
https://mobile.twitter.com/iamjosephyoung/status/1311945753909108736
13/ I’d love to validate the overall theory with OkEx, Huobi & Binance volume, but it doesn’t work that way.
New retail buyers won’t make a statistically significant impact on exchange volume that's dominated by much larger players, already in excess of a billion dollars/day.
New retail buyers won’t make a statistically significant impact on exchange volume that's dominated by much larger players, already in excess of a billion dollars/day.
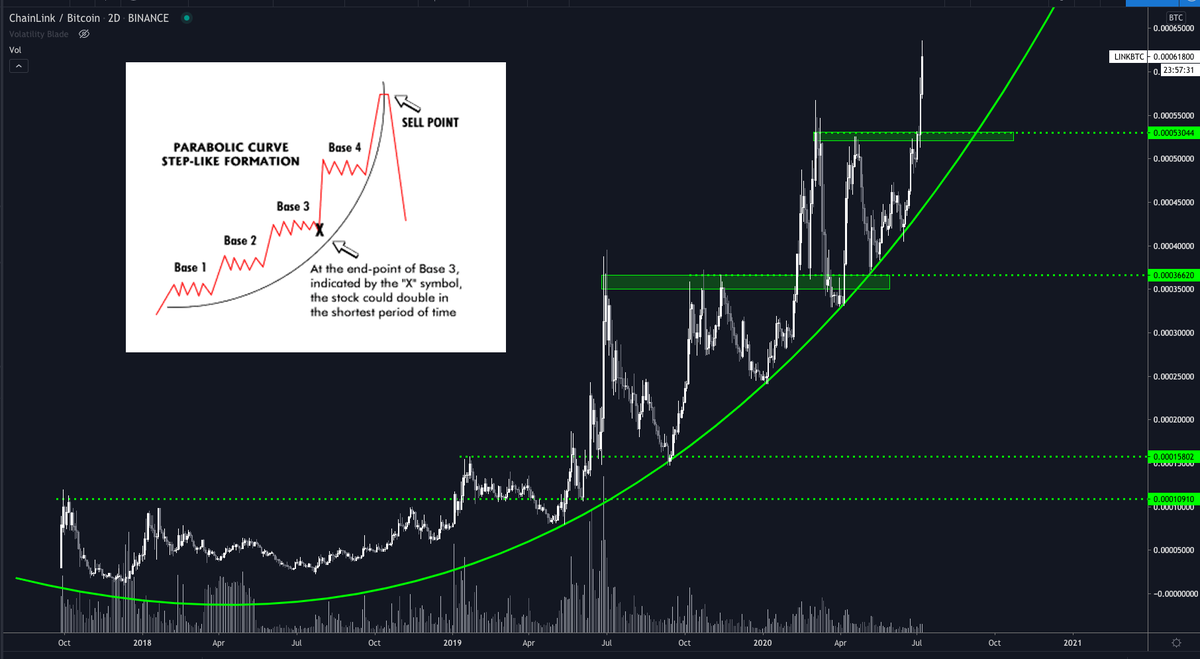
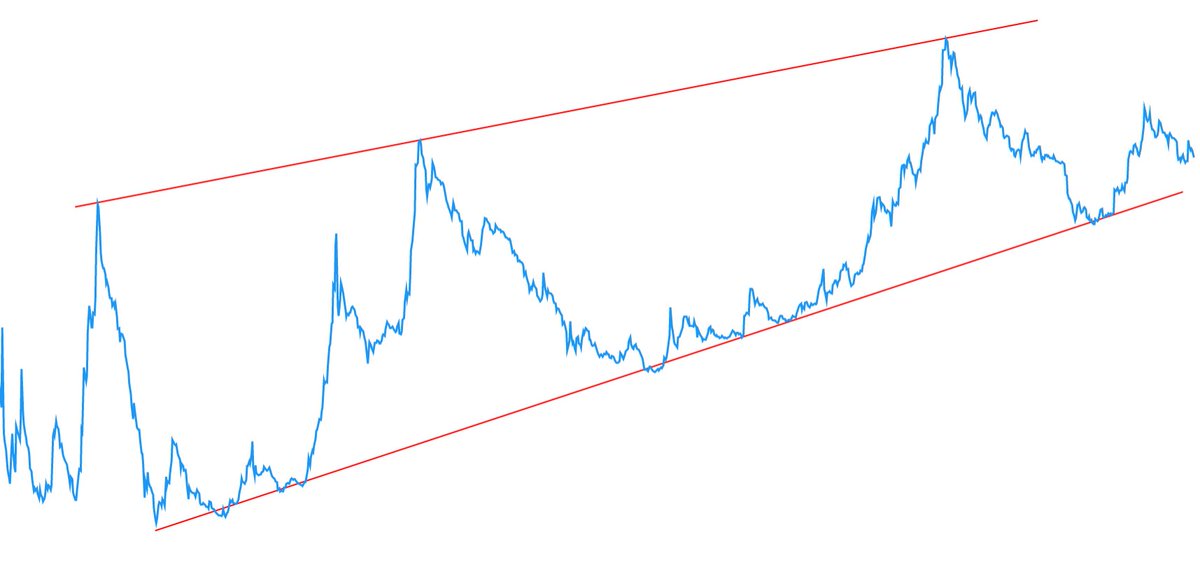
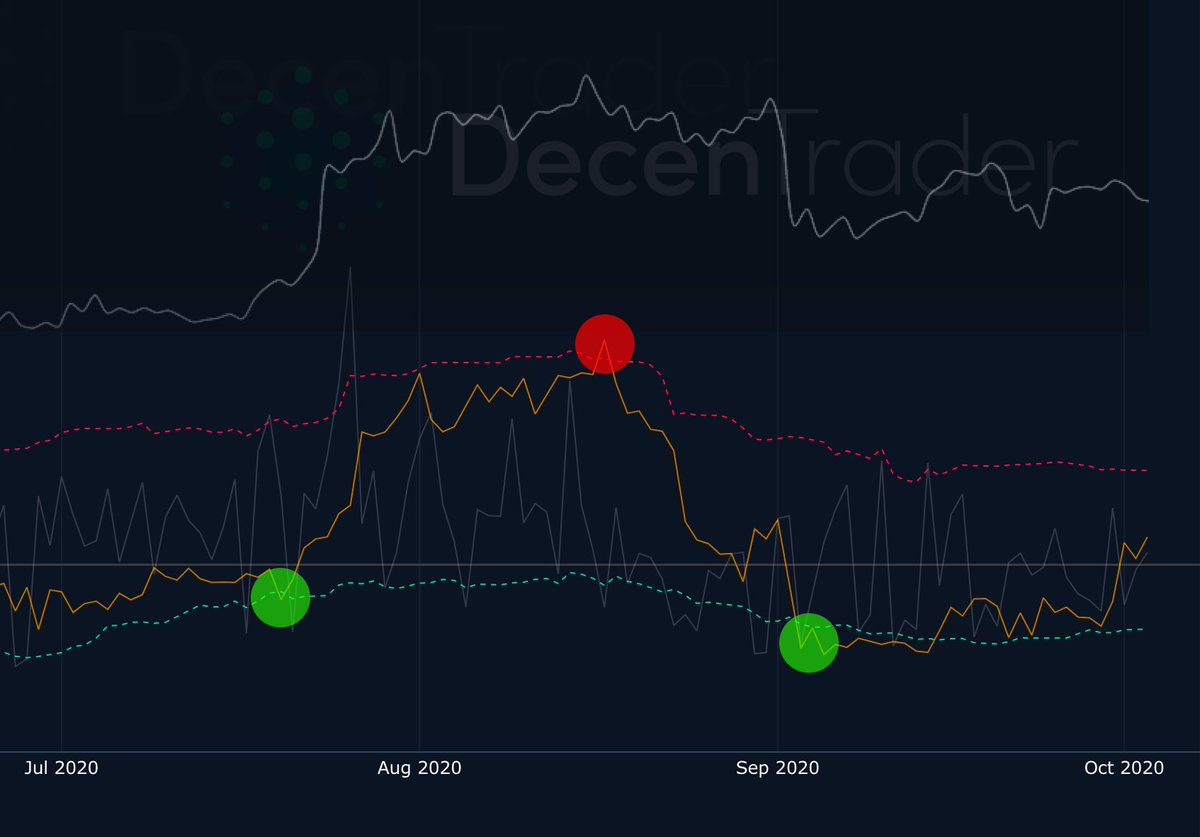
14/ Daily active addresses likely offers advanced signals on big moves throughout this bull market.
A great lens on that is Active Address Sentiment — the brainchild of my friends at @decentrader.
(@filbfilb + @philipswift)
A great lens on that is Active Address Sentiment — the brainchild of my friends at @decentrader.
(@filbfilb + @philipswift)
https://twitter.com/PositiveCrypto/status/1310619218023505923
15/ Active Address Sentiment is a cross-discipline indicator:
It does technical analysis on fundamental data.
It’s a leading indicator with a history of solid bull market signals.
It does technical analysis on fundamental data.
It’s a leading indicator with a history of solid bull market signals.
16/ Bottom line -- this news is incredibly bullish, and appears to have fundamental confirmation.
I definitely I expect more shakeouts and sideways price action moving forward.
But I'm fundamentally bullish on $BTC.
And I think hodlers will be grinning by Christmas.🎄
I definitely I expect more shakeouts and sideways price action moving forward.
But I'm fundamentally bullish on $BTC.
And I think hodlers will be grinning by Christmas.🎄
• • •
Missing some Tweet in this thread? You can try to
force a refresh