Logarithmic Eclipse /a thread
1/ Get this: BTC’s curved log price growth fully straightens out when price *and* time are charted in log scale.
The implications are fascinating — and can be used as an edge.
I’ll break it all down, and show you a new indicator I'm loving.
1/ Get this: BTC’s curved log price growth fully straightens out when price *and* time are charted in log scale.
The implications are fascinating — and can be used as an edge.
I’ll break it all down, and show you a new indicator I'm loving.

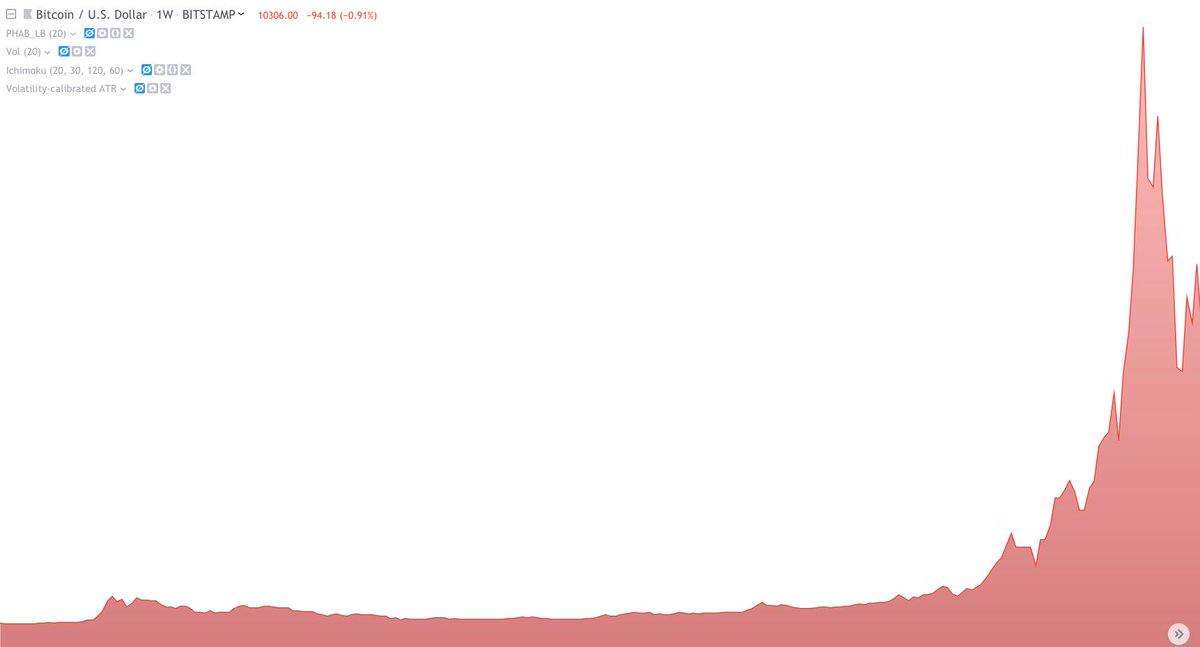
2/ First: logarithmic charts show you log price in linear time. (They are 'price-log').
But what if you charted log price in log time? ('log-log')
Tradingview doesn’t offer that option — you need a specialized platform.
But what if you charted log price in log time? ('log-log')
Tradingview doesn’t offer that option — you need a specialized platform.
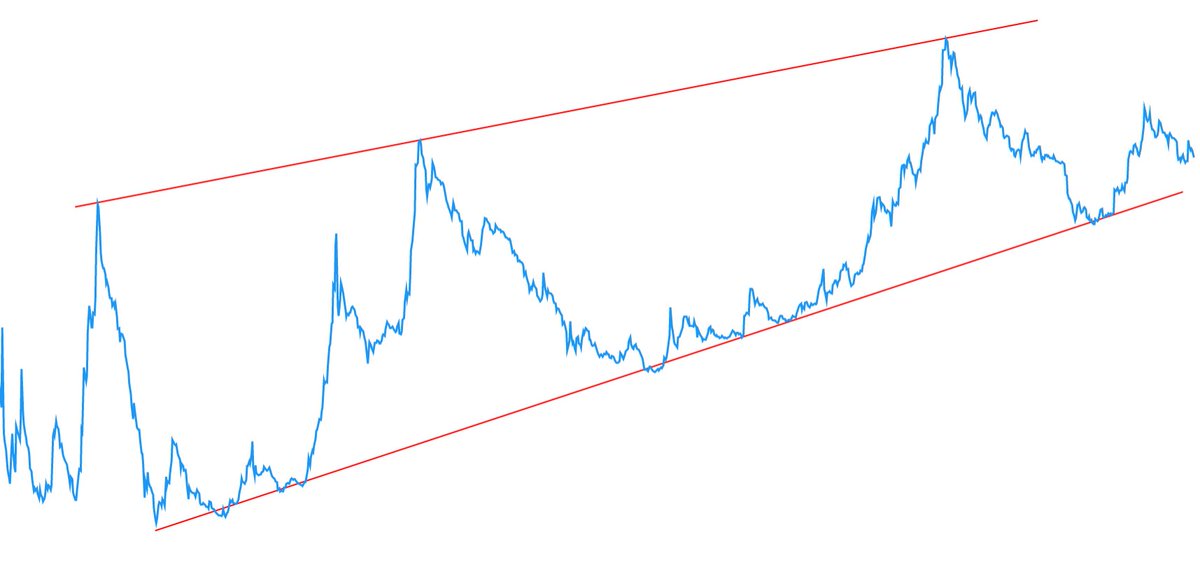
3/ Here's what you'd see:
$BTC price action on a log-log chart is *so linear* that you can draw a flat trendline through the top edge of all three bull market tops.
And another trendline through all three accumulation zone bottoms.
$BTC price action on a log-log chart is *so linear* that you can draw a flat trendline through the top edge of all three bull market tops.
And another trendline through all three accumulation zone bottoms.
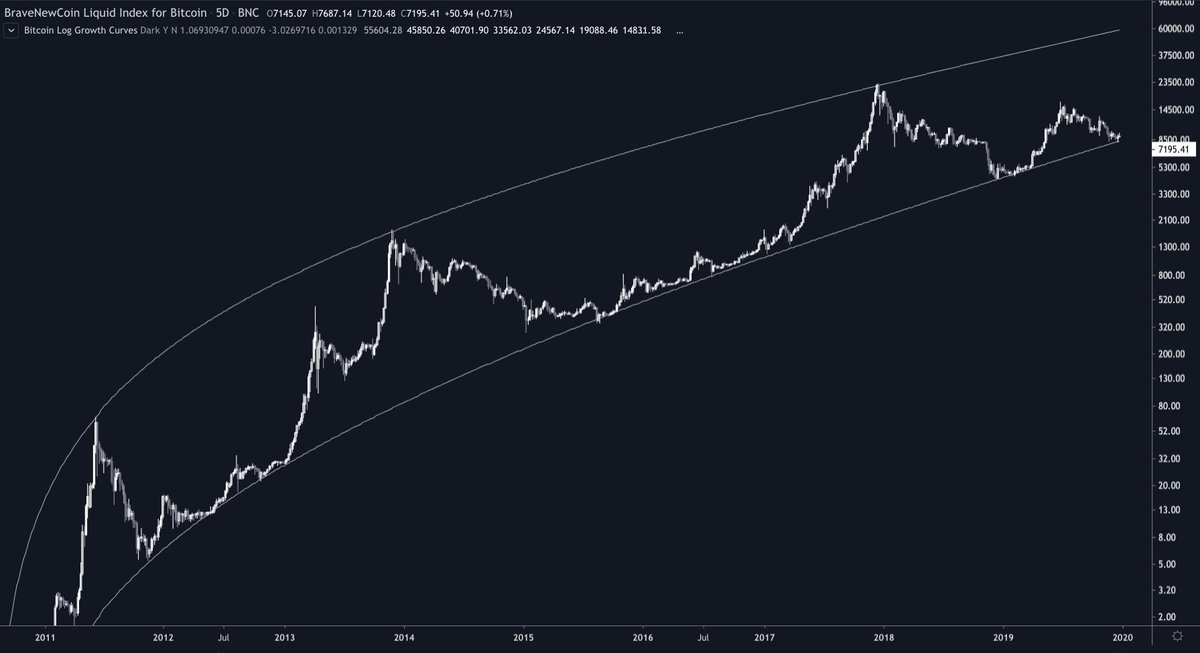
4/ A few months ago my man @quantadelic published a script that plots the top & bottom trendlines in log-log space, and translates them onto your TV log charts.
The trendlines directly overlap the top & bottom edges of BTC's adoption curve channel - they are one and the same.
The trendlines directly overlap the top & bottom edges of BTC's adoption curve channel - they are one and the same.
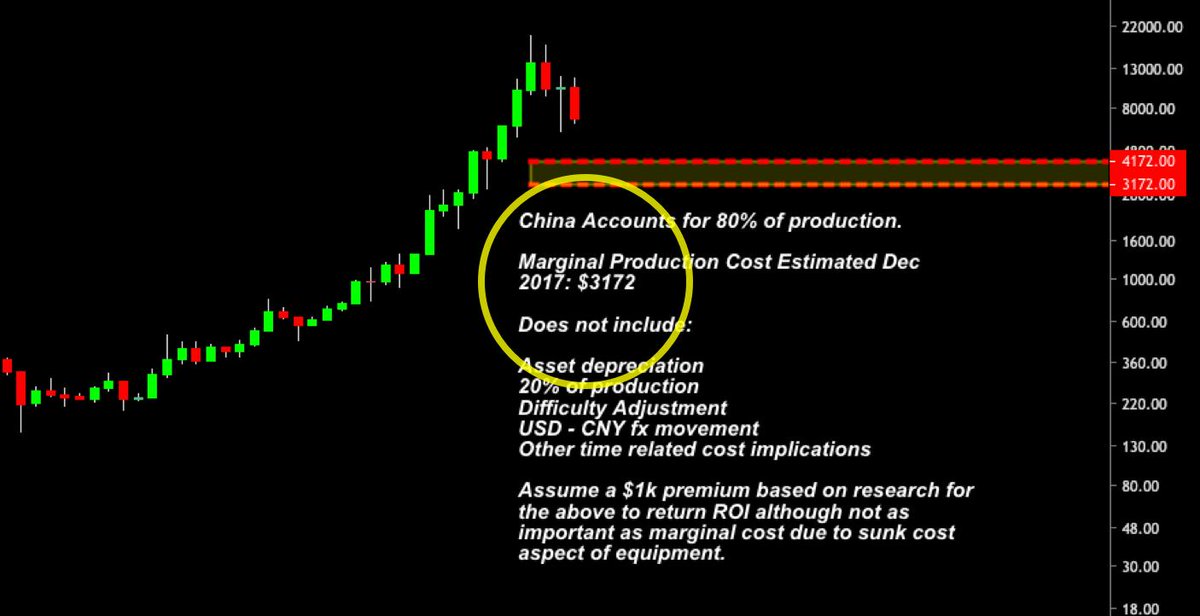
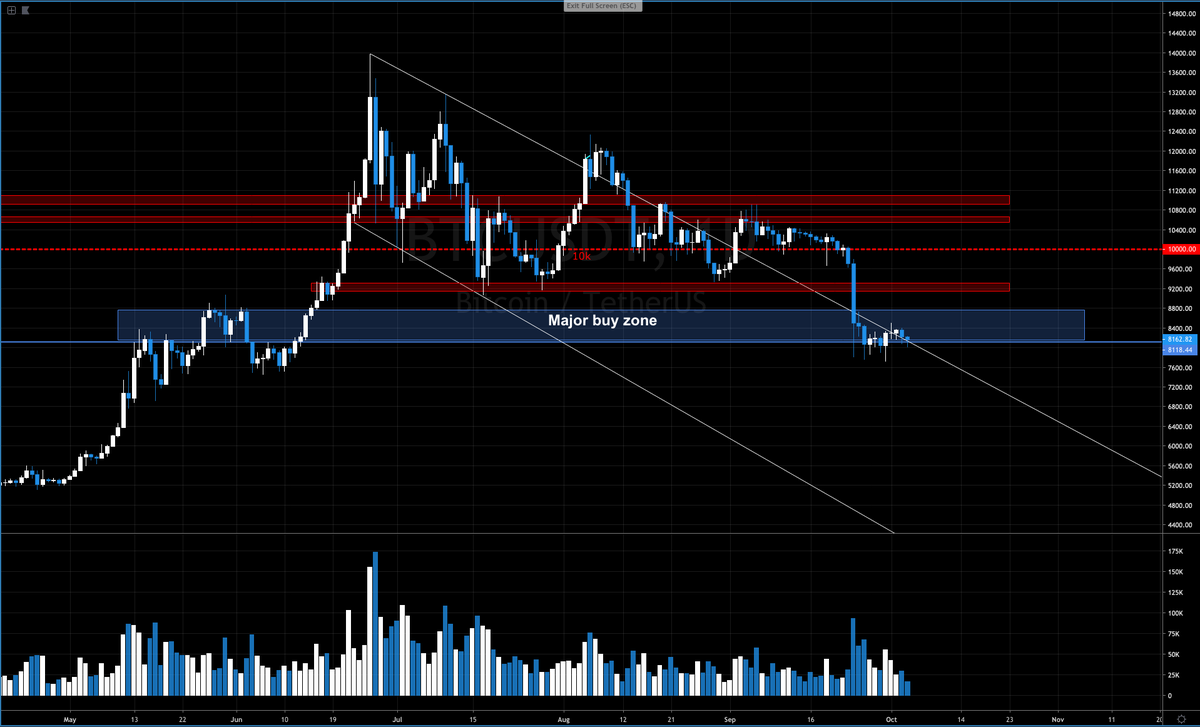
6/ Zooming in: notice how price just bounced off the channel bottom.
There's solid confluence there with BTC’s volume point-of-control for the last two years, at $6400.
I don’t expect a weekly close below that.
There's solid confluence there with BTC’s volume point-of-control for the last two years, at $6400.
I don’t expect a weekly close below that.

7/ But what if we do close below the channel?
*Don’t panic sell*
*Don’t try to sell & rebuy lower*
Price could linger underneath the channel for weeks, and it would still be a blip on the radar, big picture.
*Don’t panic sell*
*Don’t try to sell & rebuy lower*
Price could linger underneath the channel for weeks, and it would still be a blip on the radar, big picture.
8/ Anyway, on-chain investor activity is signaling re-accumulation. We may have already bottomed.
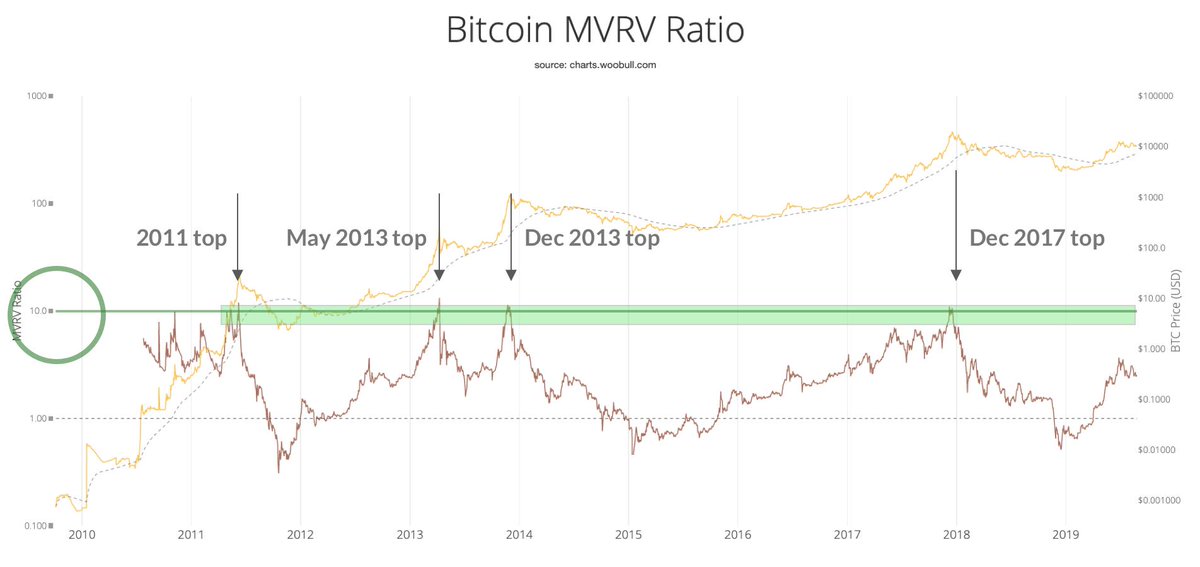
9/ Zooming out: BTC’s past cycles are a view into its highest probability future.
BTC's fundamentals are *much* stronger now than they were in 2017.
All three past bull markets rose against a backdrop of *much* greater uncertainty.
BTC's fundamentals are *much* stronger now than they were in 2017.
All three past bull markets rose against a backdrop of *much* greater uncertainty.
10/ For context on BTC’s performance over the past decade -- check out this eye-opening 60 second data viz from @JamesTodaroMD:
11/ Bottom line, anything could happen going forward.
But the highest probability scenario is another bull market.
When will things start to take off?
But the highest probability scenario is another bull market.
When will things start to take off?
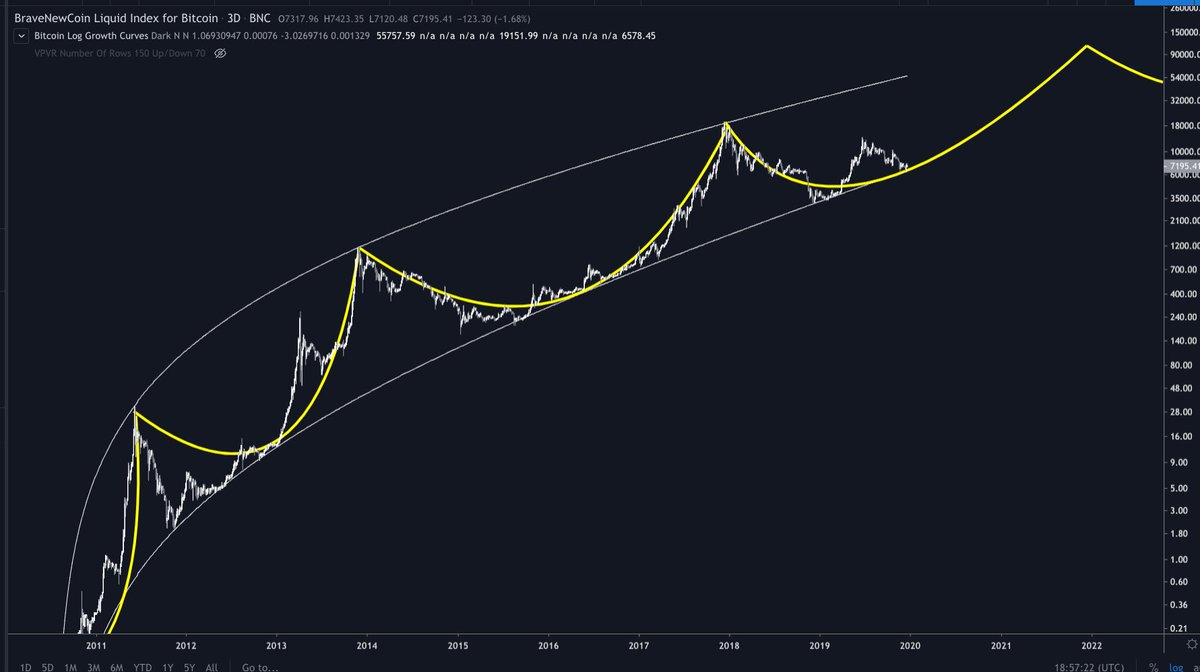
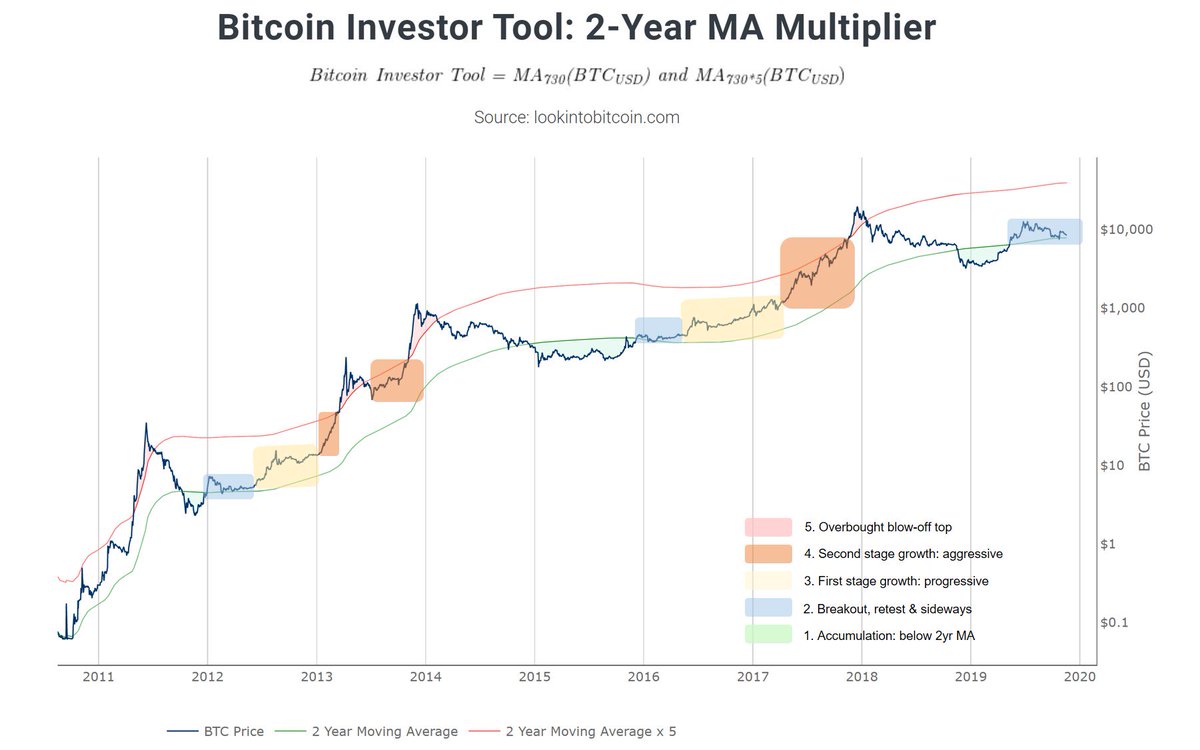
12/ @positivecrypto broke $BTC bull markets down into 5 stages.
I expect we spend much of 2020 working our way through stage 3.
And I expect new ATHs by the end of 2020. 🚀
I expect we spend much of 2020 working our way through stage 3.
And I expect new ATHs by the end of 2020. 🚀
13/ Wish things would kick off sooner?
Don’t forget the log channel’s rising trajectory:
The longer $BTC takes to reach its next top, the higher we should expect it to be.
Don’t forget the log channel’s rising trajectory:
The longer $BTC takes to reach its next top, the higher we should expect it to be.
14/ @quantadelic took things an ingenious step further and generated dynamic Fibonacci levels in between the trendlines.
And wouldn’t you know it — key fib levels interact with historic price action in amazing ways.
And wouldn’t you know it — key fib levels interact with historic price action in amazing ways.
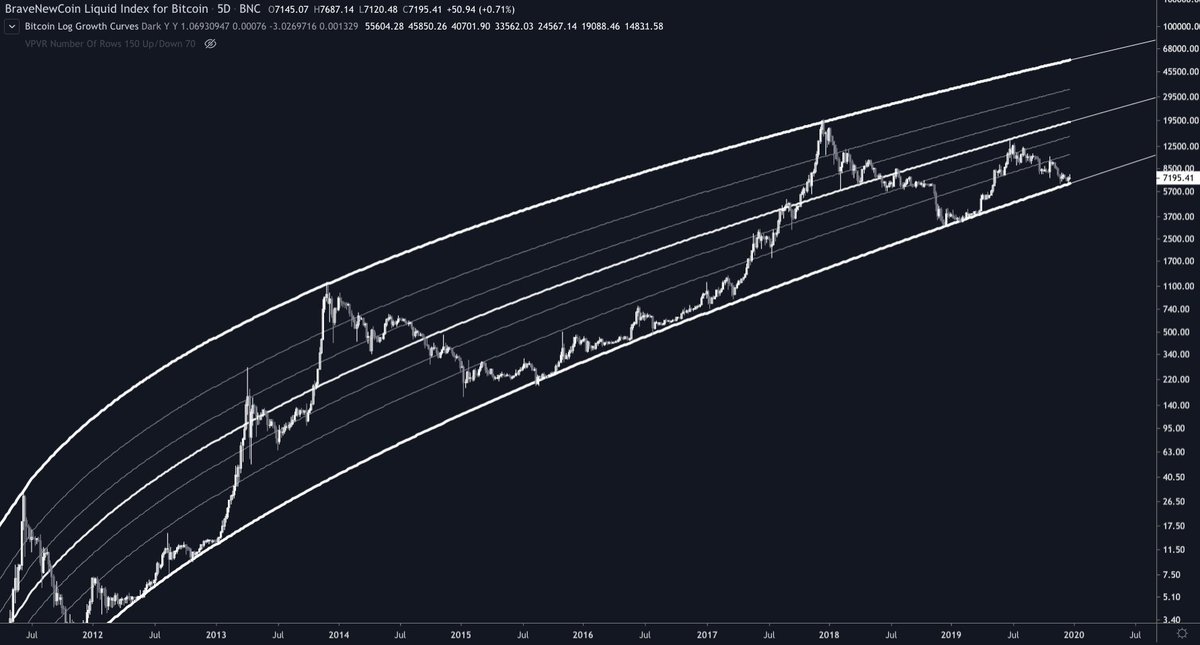
15/ The EQ of the range has served as dynamic support & resistance since the blow-off top in 2017.
For the first 6 months of the bear market, it was literally the only support level that mattered.
For the first 6 months of the bear market, it was literally the only support level that mattered.

16/ The EQ came into play again last June — right at the top of the parabola.

17/ The 38% retracement served as dynamic support & resistance every time it’s been hit since mid-2013.
The only time price didn’t bounce off the 38% was in the runup to $14k in June.
The only time price didn’t bounce off the 38% was in the runup to $14k in June.

18/ And the 78% fib — 9 out of 11 touches over the past 7 years were followed by a hard bounce.

19/ I expect @quantadelic's work to only increase in relevance as the bull market unfolds into its final stages.
Why? There's a whole other dimension to this indicator we haven’t explored.
Why? There's a whole other dimension to this indicator we haven’t explored.
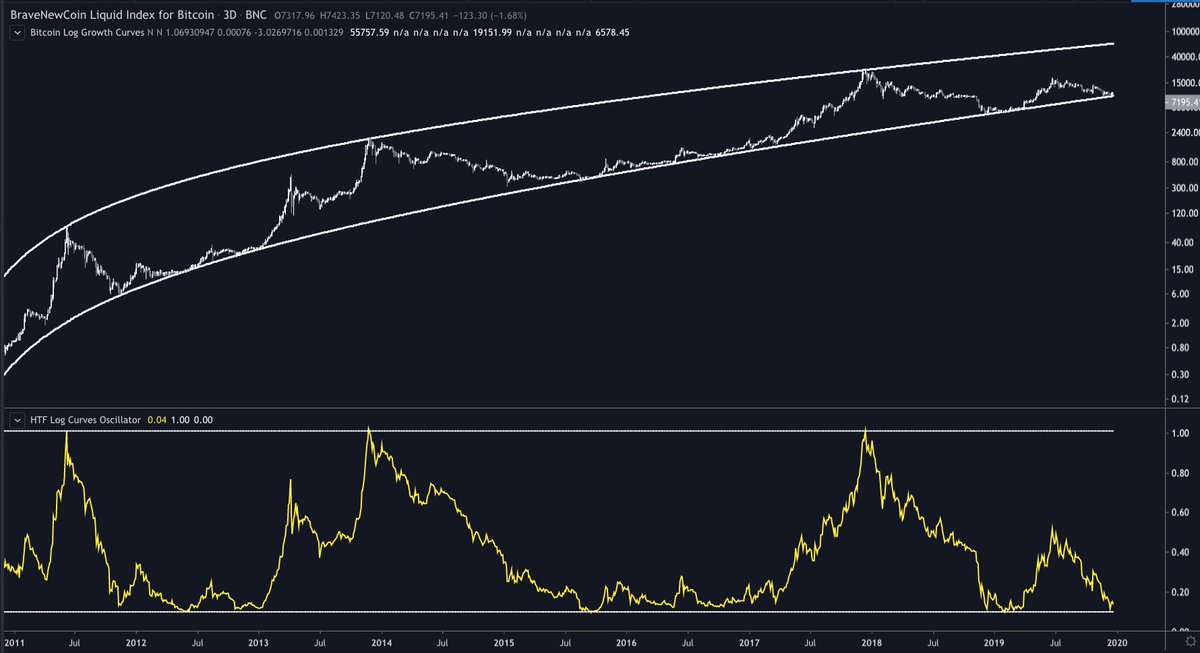
20/ @quantadelic built a second indicator that turns the trendlines into an oscillator.
Here’s one potentially very profitable way to use it:
Here’s one potentially very profitable way to use it:
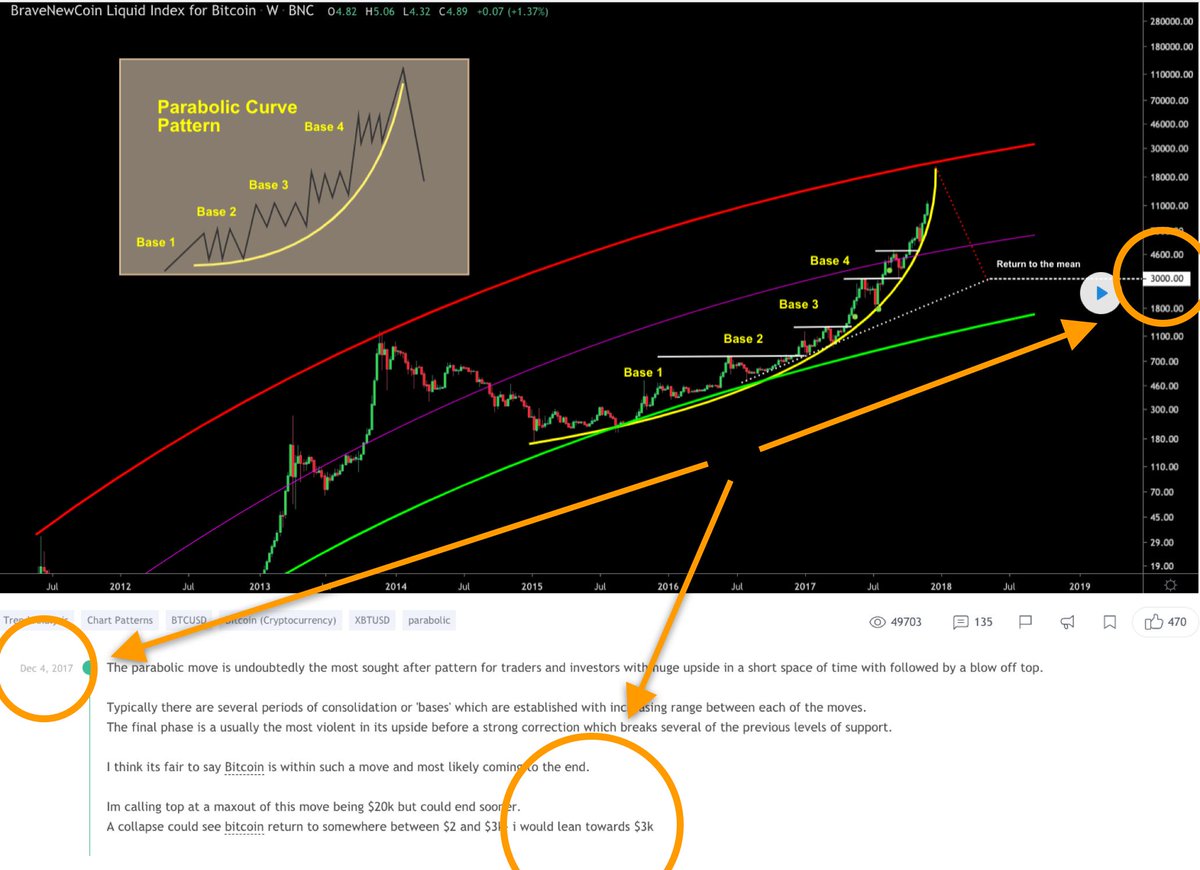
21/ $BTC bull markets form a classic parabolic arc pattern.
The *dream long* for leverage traders is the critical transition from bull market to parabolic needle.
Any data that could help us time that turning point in this current cycle, I’d consider an edge.
The *dream long* for leverage traders is the critical transition from bull market to parabolic needle.
Any data that could help us time that turning point in this current cycle, I’d consider an edge.

22/ In 2017, the transition happened around $6k. In 2013, it was around $200.

23/ Maybe it’s just coincidence - but the oscillator was in the same position for the transition, both times. The mid-50s.
Keep that in your back pocket.
Keep that in your back pocket.

24/ But that’s just the appetizer — now lets turn up the heat. 🔥
There's one final way to use the log trendlines — and its *by far* the most important way.
In log-log space, a flat trendline connects all tops.
There's one final way to use the log trendlines — and its *by far* the most important way.
In log-log space, a flat trendline connects all tops.
25/ Extend the top trendline out far enough —
And you have the top edge of a dynamic target zone, to scale out at the likeliest spot for the bull market to end.
When (and if) we get there:
It’s like an eclipse — that moment when price lines up with all previous tops.
And you have the top edge of a dynamic target zone, to scale out at the likeliest spot for the bull market to end.
When (and if) we get there:
It’s like an eclipse — that moment when price lines up with all previous tops.

26/ Of course no indicator should be used in isolation for such an important purpose.
Not when there are so many groundbreaking options to choose from.
Not when there are so many groundbreaking options to choose from.

27/ I expect a bit of backlash on this last point, from hodlers who will never sell.
To them - respect. You'll be rich.
To them - respect. You'll be rich.
28/ Bottom line - I love this indicator!
And @quantadelic open-sourced it!
Badass! 👊
Give him a follow: @quantadelic
The oscillator: tradingview.com/v/aa2VwAcI/
The trendlines: tradingview.com/v/d0JTc61s/
And happy new year!
And @quantadelic open-sourced it!
Badass! 👊
Give him a follow: @quantadelic
The oscillator: tradingview.com/v/aa2VwAcI/
The trendlines: tradingview.com/v/d0JTc61s/
And happy new year!
@quantadelic 29/ Follow up: I made a mistake in this thread.
I failed to acknowledge the pioneering work of @hcburger1, upon which all of these ideas are built.
If you’re not already following @hcburger1, you should be.
And thanks to @intheloop for bringing this to my attention!
I failed to acknowledge the pioneering work of @hcburger1, upon which all of these ideas are built.
If you’re not already following @hcburger1, you should be.
And thanks to @intheloop for bringing this to my attention!