#Canadians
There's something troubling about our #COVID19 death rates in the 2nd wave
I've calculated total per capita case & death numbers since Aug 17 (2nd wave) & compared these to values for our peer countries (high income, pop >20M)
Peers: 🇦🇺🇫🇷🇩🇪🇮🇹🇯🇵🇰🇷🇩🇪🇹🇼🇬🇧🇺🇸
Thread 🧵
There's something troubling about our #COVID19 death rates in the 2nd wave
I've calculated total per capita case & death numbers since Aug 17 (2nd wave) & compared these to values for our peer countries (high income, pop >20M)
Peers: 🇦🇺🇫🇷🇩🇪🇮🇹🇯🇵🇰🇷🇩🇪🇹🇼🇬🇧🇺🇸
Thread 🧵
Nov 11
Cumulative Wave 2 COVID-19 CASES (per 100K ppl)
Per 100K ppl, starting Aug 17 (% increase last 7d)
QC 663 (+17%)
MB 599 (+44%)
Peers 553 🇦🇺🇫🇷🇩🇪🇮🇹🇯🇵🇰🇷🇪🇸🇹🇼🇬🇧🇺🇸
AB 519 (+28%)
Canada 399 (+23%)
ON 329 (+22%)
BC 292 (+31%)
SK 225 (+47%)
Data: @covid_canada
/2
Cumulative Wave 2 COVID-19 CASES (per 100K ppl)
Per 100K ppl, starting Aug 17 (% increase last 7d)
QC 663 (+17%)
MB 599 (+44%)
Peers 553 🇦🇺🇫🇷🇩🇪🇮🇹🇯🇵🇰🇷🇪🇸🇹🇼🇬🇧🇺🇸
AB 519 (+28%)
Canada 399 (+23%)
ON 329 (+22%)
BC 292 (+31%)
SK 225 (+47%)
Data: @covid_canada
/2

The average #COVID19 per capita case number in our peer countries is higher than today's value for #Canada, although our number has increased by 23% in the last 7 days (not good).
This makes sense, though--our cases started growing later than in many European countries & US
/3
This makes sense, though--our cases started growing later than in many European countries & US
/3
However, #Canadian #COVID19 death numbers are same as peer avg
Cumulative Wave 2 DEATHS
Per 100K ppl, starting Aug 18 (% increase last 7d)
QC 9.2 (+30%)
MB 7.7 (+38%)
Canada 4.3 (+29%)
Peers 4.2 🇦🇺🇫🇷🇩🇪🇮🇹🇯🇵🇰🇷🇪🇸🇹🇼🇬🇧🇺🇸
AB 3.5 (+33%)
ON 3.4 (+26%)
BC 1.7 (+16%)
SK 0.6 (+133%)
/4
Cumulative Wave 2 DEATHS
Per 100K ppl, starting Aug 18 (% increase last 7d)
QC 9.2 (+30%)
MB 7.7 (+38%)
Canada 4.3 (+29%)
Peers 4.2 🇦🇺🇫🇷🇩🇪🇮🇹🇯🇵🇰🇷🇪🇸🇹🇼🇬🇧🇺🇸
AB 3.5 (+33%)
ON 3.4 (+26%)
BC 1.7 (+16%)
SK 0.6 (+133%)
/4

Also, Wave 2 #COVID19 case fatality rate (deaths/cases) is slowly increasing in most provinces & #Canada.
This is unexpected when cases grow fast, unless death increases quickly too.
We're seeing more early deaths than we should, or under-detected early cases who died?
/5
This is unexpected when cases grow fast, unless death increases quickly too.
We're seeing more early deaths than we should, or under-detected early cases who died?
/5

I haven't finished adjusting the longterm care and retirement home data for Canada. My analyses until today started the 2nd wave at May 26, which is last date we can compare to OECD countries, courtesy of @CIHI_ICIS.
But, per capita cases in LTC/RH is higher now than Wave 1
/6
But, per capita cases in LTC/RH is higher now than Wave 1
/6

I won't have #COVID19 death analyses for longterm care & retirement homes till tmw, when @NoLore has finished her nightly analysis.
However, based on her post this morning, we're still seeing 80% of deaths in #Canada in LTC/RHs (residential care).
/7
However, based on her post this morning, we're still seeing 80% of deaths in #Canada in LTC/RHs (residential care).
/7
https://twitter.com/NoLore/status/1326012227384700928?s=20
In Wave 1, the % of #COVID19 deaths in #Canada that occurred in longterm care & retirement homes was nearly 3X the average for OECD countries.
This % has barely decreased in Wave 2, although I need to see post-Aug 17 data to be sure (instead of post-May 25).
/8
This % has barely decreased in Wave 2, although I need to see post-Aug 17 data to be sure (instead of post-May 25).
/8
What bothers me is that it looks like nothing changed in #Canadian longterm care/retirement homes, despite the horror this spring.
Or, we're really, really under-detecting #COVID19 cases & deaths outside LTC/RH.
/fin
cc @picardonhealth @NathanStall @DrSamirSinha @NightShiftMD
Or, we're really, really under-detecting #COVID19 cases & deaths outside LTC/RH.
/fin
cc @picardonhealth @NathanStall @DrSamirSinha @NightShiftMD
forgot to note that #Canadian #COVID19 case numbers in longterm care/retirement homes come from @RyersonNIA .
You can find their tracker here: ltc-covid19-tracker.ca
You can find their tracker here: ltc-covid19-tracker.ca
And @NoLore provides an invaluable public spreadsheet documenting #COVID19 deaths in individual #Canadian residential care settings here: docs.google.com/spreadsheets/d…
Also copying in ppl discussing #COVID19 death numbers in #Quebec last night @NGrandvaux @AlexGelle @RomainM45081967 @DeNovo_Fatima
And others who document LTC/RH deaths every single day @Sue_Innovates @IacovosMichael @AAlJaishi @covidschoolsCA @Billius27 @Patrickdery
And others who document LTC/RH deaths every single day @Sue_Innovates @IacovosMichael @AAlJaishi @covidschoolsCA @Billius27 @Patrickdery
A final P.S. #Ontario #COVID19 cases & deaths in LTC/RHs are without doubt under-reported, as @NoLore & @Sue_Innovates can tell you. ON no longer reports numbers if <5/home, even though even 1 case in LTC/RHs is considered an outbreak. In ON we "see" only med-lg outbreaks.
I propose that for ON we start recording all case & death numbers listed as <5 by entering 5 in our spreadsheets instead of 1 (which is what ppl are doing now, to err conservatively).
If the numbers shoot up badly as a result, maybe ON will start reporting actual values.
If the numbers shoot up badly as a result, maybe ON will start reporting actual values.
Or we can just split the difference & enter 2.5 instead of 1 or 5 for every home listed w/ <5 cases or deaths. I bet that would cause public data to be fixed quickly.
What say you @NoLore @Sue_Innovates @RyersonNIA?
Can @COVID_19_Canada volunteers help w/ this expt?
@fisman_n
What say you @NoLore @Sue_Innovates @RyersonNIA?
Can @COVID_19_Canada volunteers help w/ this expt?
@fisman_n
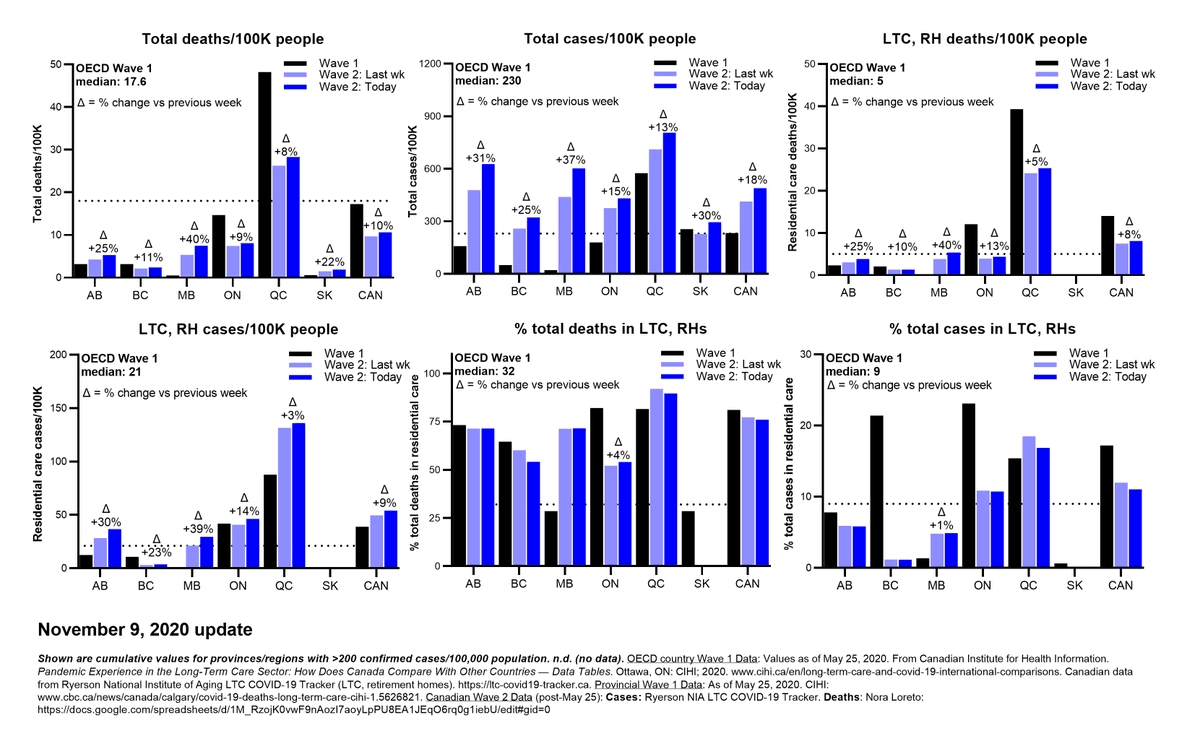
As promised
Cumulative #COVID19 DEATHS IN RESIDENTIAL CARE (LTC/RHs)
Per 100K ppl, starting May 26 (% increase last 7d)
QC 26 (+6%)
MB 6 (+44%)
ON 5 (+15%)
AB 4 (+25%)
BC 1 (+2%)
SK <1
Canada 8 (+9%)
Total deaths since late May increased 9% this week alone
Data: @NoLore
Cumulative #COVID19 DEATHS IN RESIDENTIAL CARE (LTC/RHs)
Per 100K ppl, starting May 26 (% increase last 7d)
QC 26 (+6%)
MB 6 (+44%)
ON 5 (+15%)
AB 4 (+25%)
BC 1 (+2%)
SK <1
Canada 8 (+9%)
Total deaths since late May increased 9% this week alone
Data: @NoLore

Copying in @jkwan_md @AAlJaishi @Billius27 @covidschoolsCA @Sue_Innovates @IacovosMichael for your daily share. Sorry today's post is, uh, not very compact. It started last night.
Thanks all.
Thanks all.
Something I forgot to add this morning
https://twitter.com/MoriartyLab/status/1326535918036131840?s=20
• • •
Missing some Tweet in this thread? You can try to
force a refresh