1/ Windsor, Ontario

Some chatter in Q&A’s in last few daily briefs with Premier/health officials re: rising cases in Windsor & potential for moving region to lockdown (just moved to “Red” zone on Mon, Nov 30).

Concern is hospital “overrun”… local hospital trends shown here…
2/

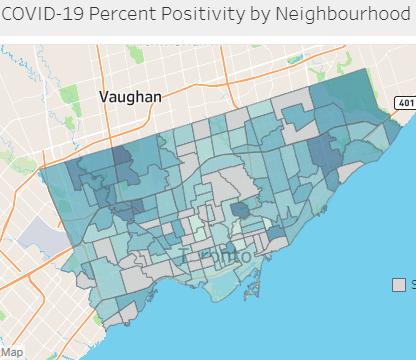
Case picture: yes, cases are rising, but overwhelming majority are traced to close contact or outbreak. Averaging only ~8 reported community cases of unknown origin per day.
3/

Overall new emergency admissions for three main Windsor-Essex hospitals appear to be:

*FLAT* for the entire month of November.

(Entire Erie-St.Clair area including Chatham/Sarnia also flat).
4/

Overall hospital admissions for respiratory illness and infections (excluding COVID19 admissions) in all of Erie-St. Clair appear to be:

*Trending down, and a full standard deviation *LOWER* vs. historical seasons*
5/

Overall hospital admissions for respiratory illness and infections (*including* COVID19 admissions) in all of Erie-St. Clair:

*Trending flat/down, and still *LOWER* vs. historical seasons*
6/

Even accounting for reporting delays, and for delays from symptom onset to, unfortunately, hospitalization, cases in Windsor have been rising since ~Oct 15, without a commensurate increase in overall emergent admissions, according to the above presented data.
7/ *IF* (and it’s still only an *IF*) Windsor, Ontario is thrown into lockdown, the people & businesses of that community would a deserve an explanation for such a measure, especially heading into Christmas season, in light of what appears to be normal/below normal hosp activity.
8/ End Thread

Data sources:
kflaphi.ca/ontario-acute-…
kflaphi.ca/aces-pandemic-…

If I am interpreting this data incorrectly, please reply to this thread to inform me/everyone.

• • •

Missing some Tweet in this thread? You can try to force a refresh
 

Keep Current with Kelly Brown

Kelly Brown Profile picture

Stay in touch and get notified when new unrolls are available from this author!

Read all threads

This Thread may be Removed Anytime!

PDF

Twitter may remove this content at anytime! Save it as PDF for later use!

Try unrolling a thread yourself!

how to unroll video
  1. Follow @ThreadReaderApp to mention us!

  2. From a Twitter thread mention us with a keyword "unroll"
@threadreaderapp unroll

Practice here first or read more on our help page!

More from @rubiconcapital_

22 Nov
1/ Toronto is entering full lockdown.

In this thread, I’ll show the absurdity of a citywide shutdown, simply using by-neighbourhood case/positivity data, w/ census data integration.

Unmeasurable, unnecessary collateral harm is coming; please read/share.

(get a cup of coffee)
2/ Note: if you are not in Toronto/Canada, you will still find this #SARSCoV2 prevalence analysis and its conclusions compelling, as these same dynamics likely exist in many of the world’s major cities.
3/ Quick note: this analysis follows and adds substantially to a previous related thread, found here (tweets 4a/b sites the data sources/limitations, which are the same as used in this current thread). All %pos/cases data is cumulative since Aug 30.
Read 39 tweets
20 Nov
1/ Brief thread… (I promise)

…focusing in on the correlations between (i) Toronto neighbourhood workforce/demographic concentrations & (ii) #SARSCov2 prevalence (cases/100k) identified in yesterday's thread.

Only a few sips of coffee/tea needed

(but this is no less striking) Image
2/ These data and observations *MUST* inform public policy on #SARSCov2/#COVI19, in my view.
3/ In my thread from yesterday, we examined % test positivity and cases/100k by neighbourhood in Toronto (for its 140 hoods) and then compared them to neighb'hood socioeconomic/demographic concentrations from census data to find (or not find) correlations.
Read 15 tweets
19 Nov
1/ Grab a cup of coffee (or tea)

A comprehensive, neighborhood-by-neighborhood review of #SARSCov2 prevalence/trends in the City of Toronto.

% positivity & cases, with weekly trends since Aug, AND:

*cross referenced with neighborhood census data*

The findings are incredible.
2/ Note: even if you are not in Toronto/Canada, I think you will find this data/analysis compelling, and universally applicable re #SARSCov2/#COVID19 learning and public policy implications.

Toronto’s diversity (>51% visible minority) makes it an interesting case study.
3a/ In this thread, I show/illustrate:

1. for Toronto’s 140 neighbourhoods (and groups of hoods, e.g. DT Core, Northwest), which have increasing/decreasing % pos & cases per 100k.

(Some peaked long before the Oct 10th restrictions. Others still increasing despite restrictions.)
Read 36 tweets
15 Nov
1/ Other Coronaviruses vs. #SARSCov2 in 🇨🇦 (continued)

Original thread below. Most striking observation was low circulation of Other Coronaviruses prior to #SARSCov2 “official” arrival in Feb/Mar 2020 in parts of Canada.

Additional observations follow…
2/ Canada-wide

Now showing prior 6 Coronavirus Seasons ('14-'20) vs. #SARSCov2

Coronavirus seasons occur like clockwork. Similar endemic peaks (~8%pos) / time frames.

%pos for #SARSCov2 in current ‘wave’ occurring much earlier vs. all prior years. PCR excess?
(see chart notes)
3/ Ontario

Similar trends. Note the seasonal decline in first “wave” of #SARSCov2 vs. timing of decline of every other Coronavirus season. Do lockdowns/restrictions really make a difference? Were we already heading down the curve when we locked down?
Read 8 tweets
14 Nov
1/ Other Coronaviruses (non-COVID19) vs. #COVID19 in Canada

Comparing %pos by week for past cold seasons vs. the 2019/2020 Novel Coronavirus season.

Three provinces: ONT, QUE, BC

I honestly don’t know how to interpret what I’m seeing but it’s eye popping to say the least...
2/ BC…

Appears to have had a normal cold season (other coronaviruses) in 2019/2020 (yellow line) compared to the prior three seasons.

#COVID19 arrives (dark black line, surges weeks 11-14), and declines (seasonally, it would appear).
3/ but Ontario and Quebec are way different…
Read 9 tweets
20 Oct
1/ #COVID19 is having a significant impact on prevalence of other common respiratory pathogens, like influenza.

Globally, since COVID began, influenza cases are down * 98% * (see tweet-link below).

The Canadian data and implications are explored here🧵

2/ Guess what

Here in Canada, flu cases also *collapsed* when #COVID19 arrived

Since mid-April to today, lab-confirmed flu cases in Canada are: 154

Average of same the time-period in previous flu seasons?

*3,836*

(…despite increased flu testing)
3/ Here is an interesting visual

The 19/20 flu season (interrupted by #COVID19) vs. avg of ’16-‘19 flu seasons. # of cases and positivity % by week.

In 19/20, flu cases/positivity dive to near ZERO, whilst previous years the decline is (i) gradual, and (ii) never reaches zero.
Read 15 tweets

Did Thread Reader help you today?

Support us! We are indie developers!


This site is made by just two indie developers on a laptop doing marketing, support and development! Read more about the story.

Become a Premium Member ($3/month or $30/year) and get exclusive features!

Become Premium

Too expensive? Make a small donation by buying us coffee ($5) or help with server cost ($10)

Donate via Paypal Become our Patreon

Thank you for your support!

Follow Us on Twitter!