1/ Ontario COVID19 Testing and You (i.e. The Taxpayer)
Conservatively estimated total cost-to-date to Ontarians for PCR testing (incl. asymptomatics)?
Over $350,000,000
At 61,809 tests today, @ ~$52.50/test, that cost you ~$3.25m, or annualized…
~$1.2 billion (with a “B”)…
Conservatively estimated total cost-to-date to Ontarians for PCR testing (incl. asymptomatics)?
Over $350,000,000
At 61,809 tests today, @ ~$52.50/test, that cost you ~$3.25m, or annualized…
~$1.2 billion (with a “B”)…

2/ The province is putting on a masterclass in resource misallocation…
For perspective, the Ontario Gov’t spends ~$4.3b annually on Long-Term Care.
That’s ~$150/day/resident, ~78,000 residents.
We are doing ~62,000 tests/day at @ ~$52.50 per test (again, ~$1.2b annualized).
For perspective, the Ontario Gov’t spends ~$4.3b annually on Long-Term Care.
That’s ~$150/day/resident, ~78,000 residents.
We are doing ~62,000 tests/day at @ ~$52.50 per test (again, ~$1.2b annualized).

3/ We should probably ask the question…
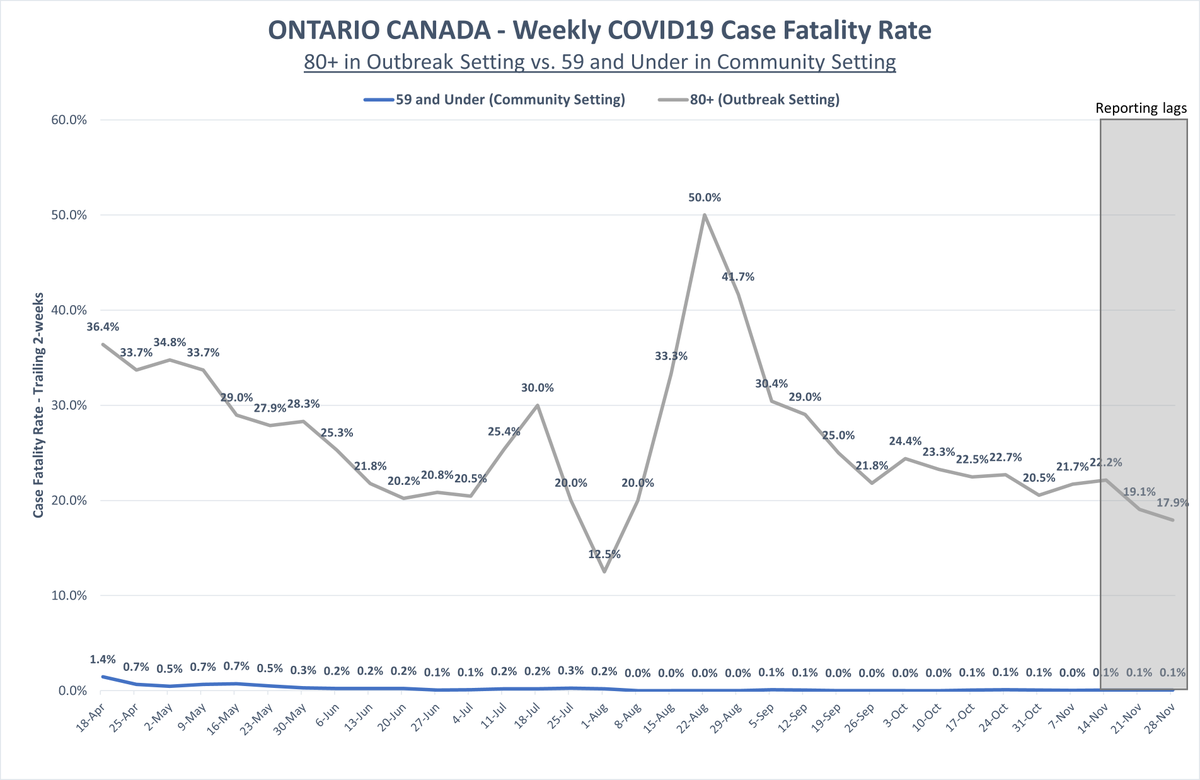
Given (i) the age stratified differences in COVID19 mortality, and (ii) that almost 2/3rds of all COVID19 mortality were of LTC residents, does it make sense to spend 27% of the annual LTC budget on mass PCR testing?
Given (i) the age stratified differences in COVID19 mortality, and (ii) that almost 2/3rds of all COVID19 mortality were of LTC residents, does it make sense to spend 27% of the annual LTC budget on mass PCR testing?
4/ It doesn’t.
…to be fair, the Ont gov’t will invest in LTC: in its recent 2020 Budget, it earmarked ~$1.75b to increase LTC capacity by 30,000 beds (not completed ‘til ‘22).
…so your annual testing cost, taxpayer, is in the ballpark of the cost of needed LTC investments.
…to be fair, the Ont gov’t will invest in LTC: in its recent 2020 Budget, it earmarked ~$1.75b to increase LTC capacity by 30,000 beds (not completed ‘til ‘22).
…so your annual testing cost, taxpayer, is in the ballpark of the cost of needed LTC investments.

5/ So just to drive the point home, we are spending on an annual run rate basis ~$1.2 billion for PCR testing, which is 27% of the annual LTC budget, and ~70% of needed long-term LTC investments.
6/ All this spending and resource misallocation (in my view) may come home to roost, as indicated today by the Ontario Financial Accountability Officer… 

7a/ Test cost sources:
~$57.50/test: ncbi.nlm.nih.gov/pmc/articles/P…
~$47.50/test: 680news.com/2020/09/30/680…
~$57.50/test: ncbi.nlm.nih.gov/pmc/articles/P…
~$47.50/test: 680news.com/2020/09/30/680…
7b/ An additional estimate here of ~$100-125 per test, given by a #COVIDZero proponent (so my using an estimate of ~$52.50 could be rather conservative).
https://twitter.com/jwoodgett/status/1308509069918056448
8/ End thread.
...and another note to the journos…
You need to get to the bottom of three things:
1. The actual all-in cost per COVID19 test
2. The % of tests processed by private, non-public labs
3. The major public lab beneficiaries of this testing spend
...and another note to the journos…
You need to get to the bottom of three things:
1. The actual all-in cost per COVID19 test
2. The % of tests processed by private, non-public labs
3. The major public lab beneficiaries of this testing spend
• • •
Missing some Tweet in this thread? You can try to
force a refresh


