1/
Vaccine debate now brewing on (i) who gets it first, and (ii) vaccine rates required for herd-immunity & getting back to normal.
Public Health says no normal ‘til vax rates are 60-70% (*assumed* herd threshold).
The Toronto data says perhaps just 10.9%...
Let’s explore…
Vaccine debate now brewing on (i) who gets it first, and (ii) vaccine rates required for herd-immunity & getting back to normal.
Public Health says no normal ‘til vax rates are 60-70% (*assumed* herd threshold).
The Toronto data says perhaps just 10.9%...
Let’s explore…

2/
I’ll get to the data in a moment, but first, I present two opposing viewpoints, then you can decide what the data says makes the most sense…
I’ll get to the data in a moment, but first, I present two opposing viewpoints, then you can decide what the data says makes the most sense…
3a/
1st view, Dr. Yaffe today in Ontario:
“its gonna take months before…significant % of the pop vaxx’d--usually for infectious diseases 60-70% of the pop is needed for herd immunity; we’re not gonna get there until probably the summer”… 22m:30s:
1st view, Dr. Yaffe today in Ontario:
“its gonna take months before…significant % of the pop vaxx’d--usually for infectious diseases 60-70% of the pop is needed for herd immunity; we’re not gonna get there until probably the summer”… 22m:30s:
3b/
…Dr. Fauci said essentially the same thing to Axios on Dec 10th:
“Once 75%-80% of people get vaccinated against the coronavirus, there should be strong enough herd immunity that we can return to normal activities.”
…Dr. Fauci said essentially the same thing to Axios on Dec 10th:
“Once 75%-80% of people get vaccinated against the coronavirus, there should be strong enough herd immunity that we can return to normal activities.”


3c/
…and Bill Gates with essentially the same view:
…and Bill Gates with essentially the same view:
https://twitter.com/tomselliott/status/1338196775564435459?s=20
4a/
2nd view, held by Dr. Jay Bhattachayra of the @gbdeclaration, is more nuanced:
Paraphrased, “We know the elderly are the most vulnerable people…vaccinate the elderly, end the lockdown in two months… the key idea is we want to minimize the mortality from this disease…
2nd view, held by Dr. Jay Bhattachayra of the @gbdeclaration, is more nuanced:
Paraphrased, “We know the elderly are the most vulnerable people…vaccinate the elderly, end the lockdown in two months… the key idea is we want to minimize the mortality from this disease…
4b/
…and so we find the people most likely to die if infected and give the vaccine to them first…vaccinate to minimize mortality in the short run and then end the lockdown.”
…and so we find the people most likely to die if infected and give the vaccine to them first…vaccinate to minimize mortality in the short run and then end the lockdown.”
5/
So one camp says no normal until great majority of population is vaccinated, another other camp says vaccinate the most at risk to reduce mortality, and let society open up as we do so.
Okay, now onto the data….
So one camp says no normal until great majority of population is vaccinated, another other camp says vaccinate the most at risk to reduce mortality, and let society open up as we do so.
Okay, now onto the data….
6/
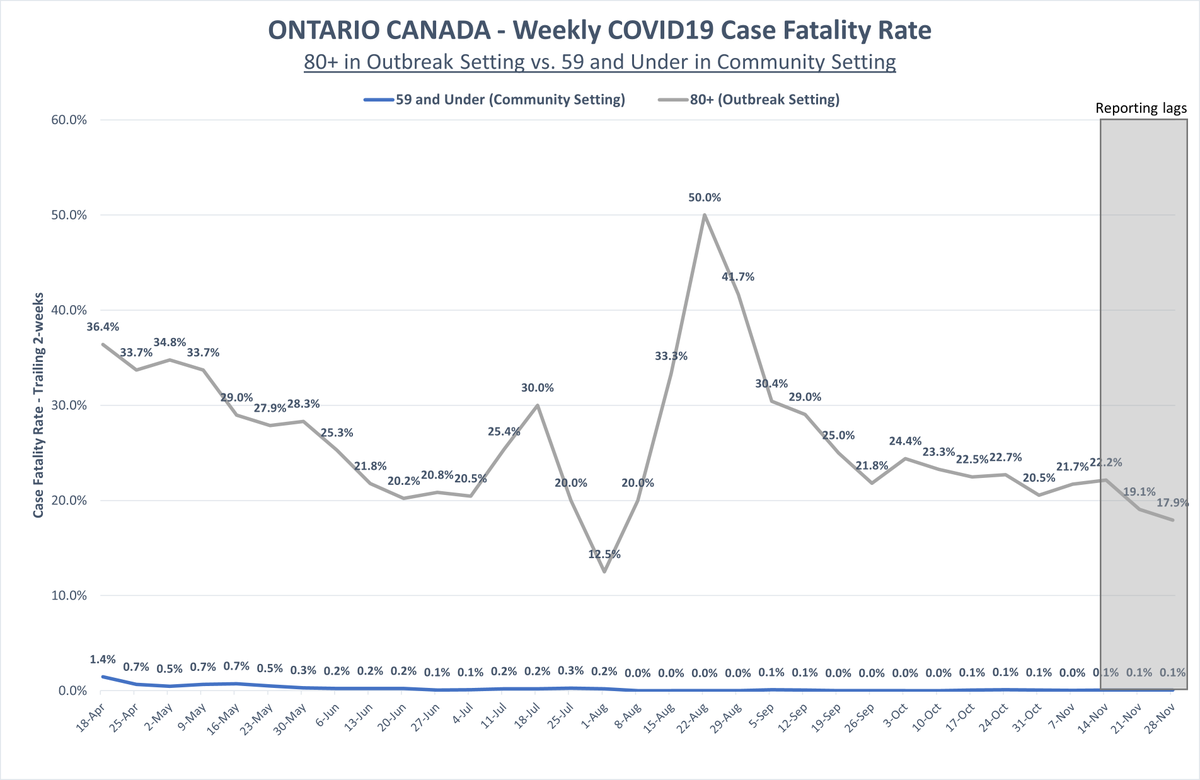
The data says (and we all already know this) that while anyone can get infected with COVID19, the risk of a bad disease, hospitalization and /or mortality is exponentially greater for certain age groups and health risks…
The data says (and we all already know this) that while anyone can get infected with COVID19, the risk of a bad disease, hospitalization and /or mortality is exponentially greater for certain age groups and health risks…
7/
In Toronto we have case hospitalization data, so we can show…
The *age-stratified risk* of hospitalization given a COVID19 infection (which will likely be the same as everywhere).
30x+ more risk of hospitalization in the very old vs. the young...
In Toronto we have case hospitalization data, so we can show…
The *age-stratified risk* of hospitalization given a COVID19 infection (which will likely be the same as everywhere).
30x+ more risk of hospitalization in the very old vs. the young...

8/
And 1000x more risk of mortality in the very old vs. the young….
And 1000x more risk of mortality in the very old vs. the young….

9/
In Toronto, ages 70 and above account for just ~10.9% of the population, yet they, sadly, account for * 52.2 % of all COVID19 hospitalizations, and * 87.3% * of all COVID19 deaths.
Shown visually:
In Toronto, ages 70 and above account for just ~10.9% of the population, yet they, sadly, account for * 52.2 % of all COVID19 hospitalizations, and * 87.3% * of all COVID19 deaths.
Shown visually:

10/
Said another way…
In Toronto, there are ~296,000 people 70+. If we successfully vaccinated this group (assuming the vaccination is 95% effective), then we would have reduced COVID19 hospitalizations by almost 50%, and deaths by ~83%...
Said another way…
In Toronto, there are ~296,000 people 70+. If we successfully vaccinated this group (assuming the vaccination is 95% effective), then we would have reduced COVID19 hospitalizations by almost 50%, and deaths by ~83%...

11/
…and most powerfully, we would have reduced the overall mortality rate from 1.23%, to:
0.16% for 69 and younger, and * JUST 0.05% * for 59 and younger!
(using age-stratified case mortality rates for the second wave (i.e. more accurate))
…and most powerfully, we would have reduced the overall mortality rate from 1.23%, to:
0.16% for 69 and younger, and * JUST 0.05% * for 59 and younger!
(using age-stratified case mortality rates for the second wave (i.e. more accurate))

12/
So do we really need to vaccinate 60-70% of the pop to reduce mortality & severity, end devastating lockdowns, and get back to normal?
Well… we just showed that vaccinating just * TEN PERCECT * of Toronto’s population will reduce overall disease severity significantly.
So do we really need to vaccinate 60-70% of the pop to reduce mortality & severity, end devastating lockdowns, and get back to normal?
Well… we just showed that vaccinating just * TEN PERCECT * of Toronto’s population will reduce overall disease severity significantly.
13/
So you decide whether Fauci/Gates/Yaffe have the right view, or whether Dr. Jay Bhattacharya and his colleagues @sunetragupta and @MartinKulldorff are onto something….
End thread.
So you decide whether Fauci/Gates/Yaffe have the right view, or whether Dr. Jay Bhattacharya and his colleagues @sunetragupta and @MartinKulldorff are onto something….
End thread.


• • •
Missing some Tweet in this thread? You can try to
force a refresh