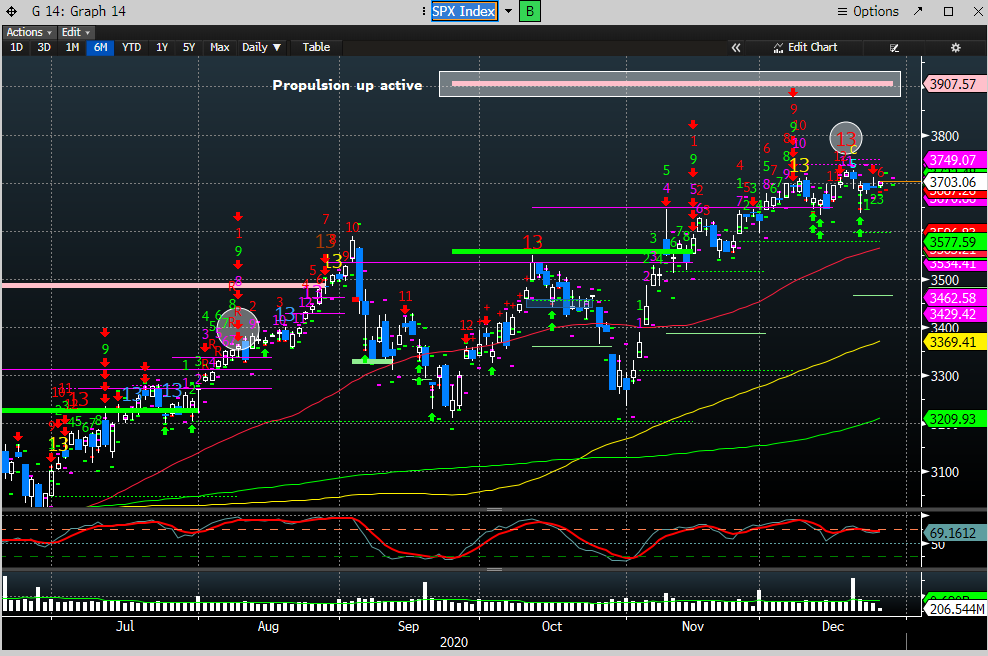
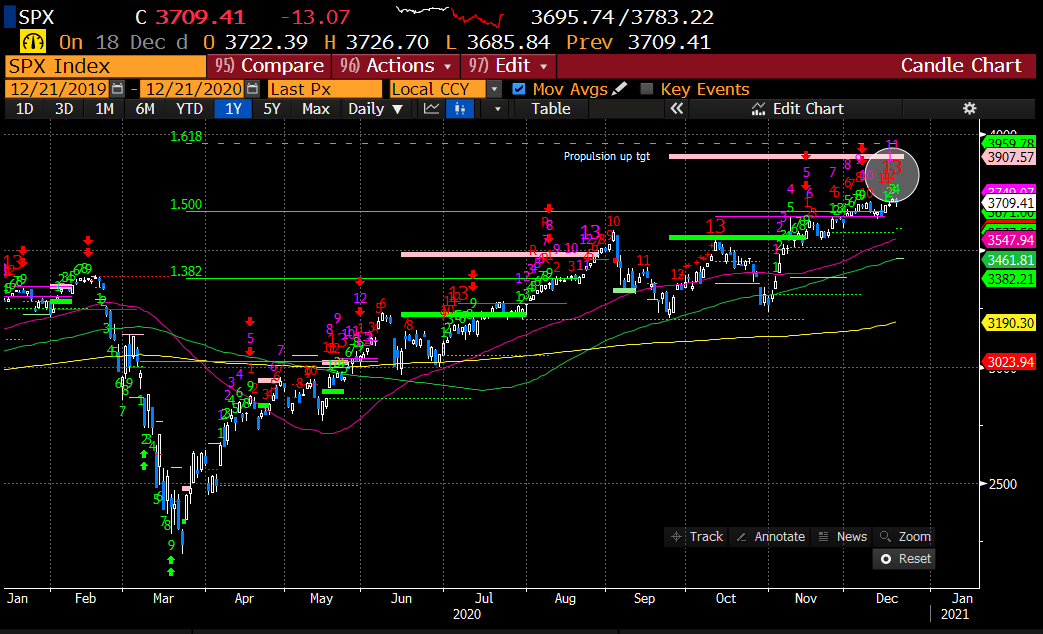
#StockMarket WE update. Tough to make much sense out of the last 2 wks given all the rebalancing. Still think Jan is set up for some giveback. #SPX cluster of Demark 13 sells, new combo 13 sell, w/ risk lvl @ 3788. Prop up still active w/ 3907 tgt. maybe quick run to 3900 first?
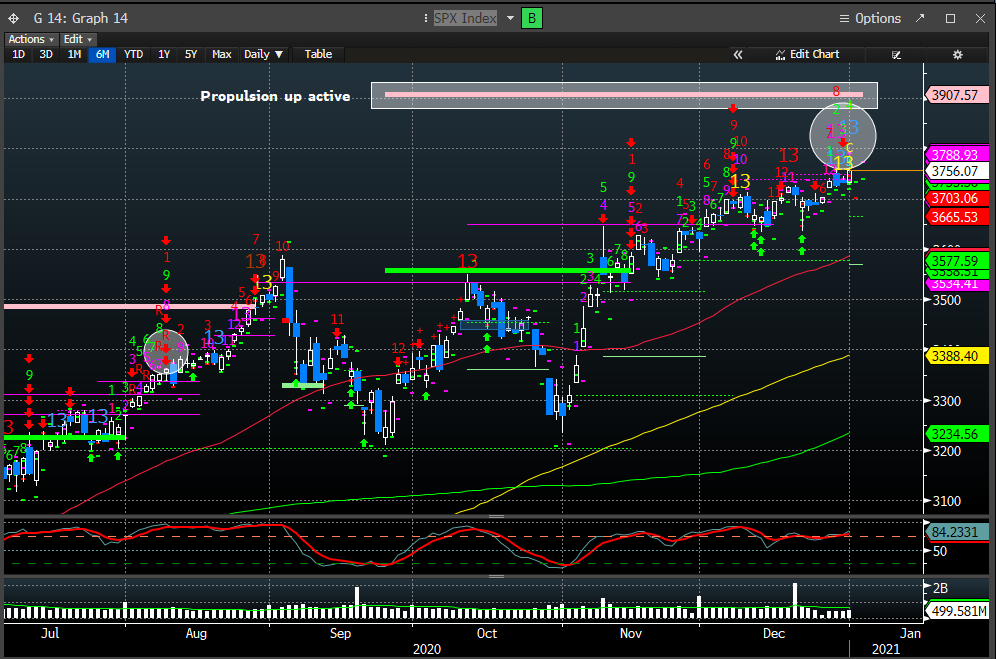
#StockMarket As I've said repeatedly, tough to be overly bearish above 3630ish & a close below the 20day has been elusive. A close below might shake things up but for now new box B/O w/ measured move to 3800+...
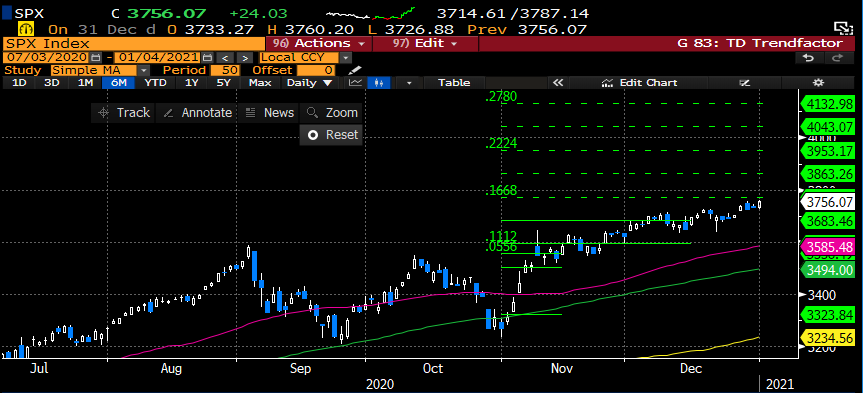
#StockMarket Demark Trendfactor is fantastic for understanding lvls in the indexes that matter. We are currently approaching the 3x lvl @ 3773, nxt lvl up is 3863 & then 3953....
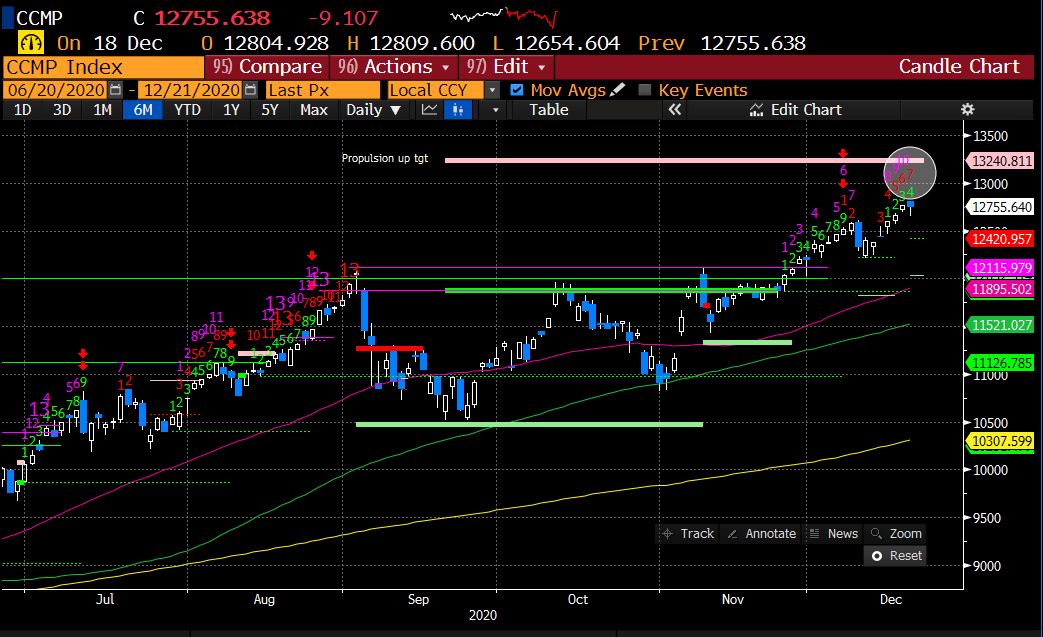
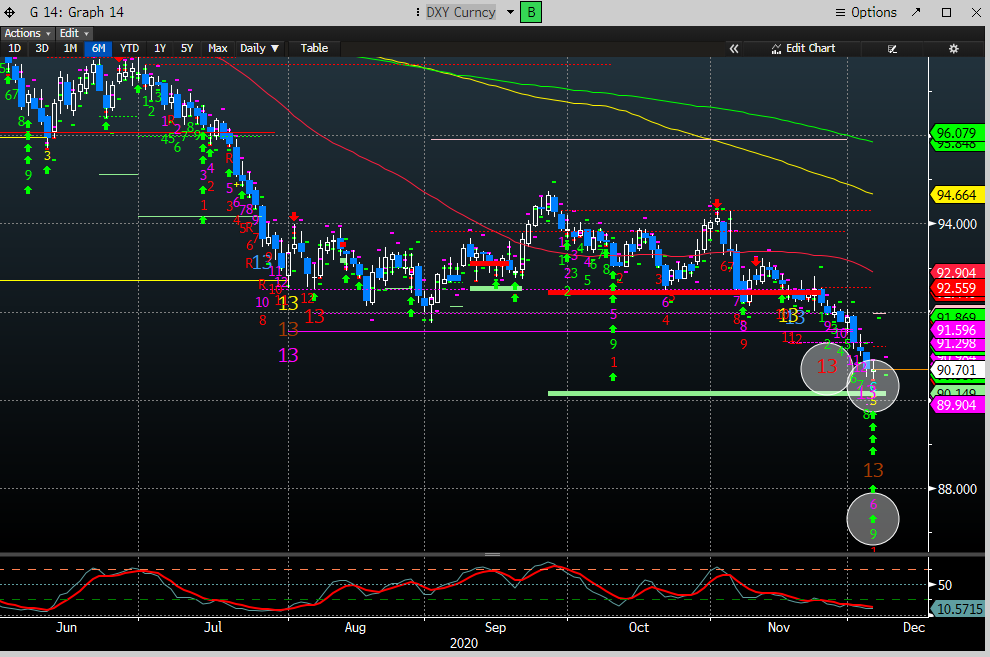
#StockMarket #nasdaq also w/ some Demark exhaustion on the daily - 13 combo/9 sell last wk & new 10 seq count, so a new 13 seq sell could post by weds. Similar to #SPX, the Naz also has a propulsion up tgt of 13240....
#stockmarket Demark trendfactor for the NAZ lvls of interest are 13012, 13330. Similar to the #SPX, the chart does look quite healthy, >12100, hard to be overly bearish....
#StockMarket Naz weekly Demark chart also posted new 9 sell last wk & thus far has ignored the 13 combo sell from 11/13, but risk lvl still in tact @ 13272, which coincidentally is slightly above the propulsion up tgt I cited above...
#StockMarket #SPX weekly Demark chart shows a possible exhaustion count 2 wks away - currently on 11 combo sell....
#stockmarket The aforementioned Demark signals piling up, extreme sentiment readings & the following red flags are increasingly making me cautious in the NT. #SPX OBV starting to show a weakening trend despite #SPX making new highs. If this keeps weakening, i'd be worried....
#StockMarket #SPX MACD still negatively diverging, but could cross + w/ strength this wk so needs to be monitored...
#stockmarket #SPX RSI still negatively diverging but also showing it might erase the divergence with some strength...
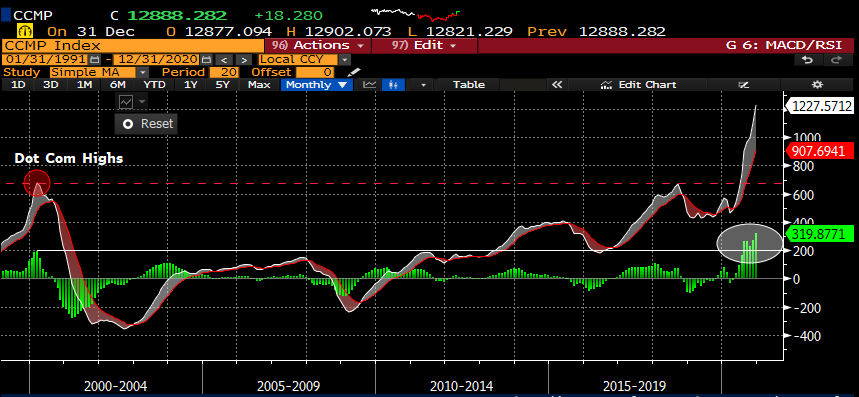
#stockmarket #SPX monthly MACD gap is the highest EVER (as far back as I can tell anyway). The momentum is clearly bullish, but usu this sort of excess gets corrected by price or time (last peak in 2/04 didnt see the index make a new high until 11/04)...
#StockMarket #nasdaq is much worse and has been above the dot com mania high since Aug. Keep in mind the last time we saw this much momentum it took the Naz 16 years to make a new high. food for thought....
#StockMarket Net new high list is also negatively diverging while the index is making ATH's. not a great development and could be signaling the end of the move....
#StockMarket #SPX weekly stocks over the 200day w/ Demark overlay, still well above lvls where corrections occur, now w/ combo 13 sell recently and starting to negatively diverge...
#StockMarket McClellan Summation Index w/ Demark overlay w/ recent 13 sells did correctly call the turn in the index but the #SPX kept making new highs - This means the index will catch down or MSI will turn back up, which could post a 9 buy, & pot'l 13 combo buy this wk...
#StockMarket Some dissension on what a recent rising put/call means, which usu is a contrarian signal but coming from such a depressed lvl w/ indexes @ ATH's, i'll take the other side. If this continues to rise, as shown in this chart, it signals retracements...
#StockMarket $VVIX or vol of vol could pot'l post a daily Demark 13 this wk (current 10 count). Last 13 buy saw this index rise +36% & the $VIX +80%. VIX short positioning w/ Demark overlays also with a cluster of 13 buys - 5 of last 5 saw VIX spikes. cheap protection a + idea...
#StockMarket Consumer discretionary vs staples is a good barometer of risk, has been breaking out to new highs which is very bullish, but also w/ a new combo 13 sell likely this wk. 3 of last 4 signaled retracements, 2 of which were meaningful....
#stockmarket #SPX bollinger band chart did close above the upper bound, 2 months in a row, a rare signal and also usually corrected by price over the NT....
#stockmarket but not all bad, Ad/Decline did B/O to all time highs last week, which is never not bullish. And the Smart Money Index back-tested its B/O level = also bullish....
#StockMarket Concl: Lots of reasons to keep me cautious in the NT but tough to be overly bearish unless price confirms all these red flags, which so far it hasnt. That said, my goal is to avoid a costly drawdown, so heavy cash, + hedges, tactical trading w/ tight stops. GL!

• • •

Missing some Tweet in this thread? You can try to force a refresh
 

Keep Current with CoiledSpringCapital

CoiledSpringCapital Profile picture

Stay in touch and get notified when new unrolls are available from this author!

Read all threads

This Thread may be Removed Anytime!

PDF

Twitter may remove this content at anytime! Save it as PDF for later use!

Try unrolling a thread yourself!

how to unroll video
  1. Follow @ThreadReaderApp to mention us!

  2. From a Twitter thread mention us with a keyword "unroll"
@threadreaderapp unroll

Practice here first or read more on our help page!

More from @coiledspringcap

27 Dec 20
#stockmarket WE update - Holiday short version. $SPY shows 2 broken rising wedges but minimal damage. Nasty pierce of the 20day & support last wk but strong close & no follow thru. Resiliency matters & for now bulls in control. Currently 3 distribution days in Dec...
#stockmarket A close below $364ish would shake things up a bit I suspect but elusive at this point. $SPY weekly looks quite healthy to me....
#stockmarket #SPX recent Demark 13 seq sell did mark the recent swing high, now on day 3 of buy set up. Remember, 13's can signal pot'l trend change or sometimes just stall the trend - for now its stalled. Do we continue lower to complete the 9 buy or price flip back up & resume?
Read 13 tweets
20 Dec 20
#stockmarket WE update. Last WE I mentioned I was cautiously optimistic but could see some weakness in 2H of the wk as Demark could post a Seq 13 sell on the #SPX. Friday was weak but somewhat contained. I also mentioned that Propulsion up was still active w/ 3907 tgt....
#stockmarket Momentum tgts signify trend continuation but also could represent exhaustion points. The Russell also w/ new Demark 13 sells on the weekly chart to go w/ a new round of daily sell signals....
#stockmarket #NASDAQ could post a new combo 13 sell this wk (pot'l weds) & a seq 13 sell next wk (pot'l Tues), but much like the #SPX, has a propulsion up tgt in play of 13240....
Read 16 tweets
13 Dec 20
#stockmarket WE update. Last wk I mentioned to be careful adding new money to the mkt, which was the correct call as we did see weakness. I mentioned watching the $DXY for signals as it did move off the lows. But 20day save on Fri above key lvls for #SPX is bullish for now....
#stockmarket As I've mentioned in previous updates, $ spikes are equity bearish & last wk we did see #DXY move off the lows. Whether this a minor bounce or bigger countertrend move is yet TBD. $DXY bounce from OS RSI now above 14day SMA & day 3 of price flip; needs to be watched.
#stockmarket I also discussed in last WE update that key global mkts were also flashing Demark exhaustion signals & something that could hurt US stock performance - see 5 day performance of major indices....
Read 15 tweets
6 Dec 20
#stockmarket WE update. crazy bullish euphoria is all that comes to mind. But that doesn't mean it has to end. I think we are stretched which can be resolved by time or price. >3645 tough to be overly bearish, but putting new money to work up here seems foolish....
#stockmarket #SPX correlation to USD has been strong & previous spikes this yr have seen equity dislocation. This is the most important thing to watch IMO given how lopsided this trade has become. Demark has a 13 Seq/Combo & 9 buy in place/ w/ prop down tgt of 90.15 for $DXY...
#stockmarket the $DXY has closed below the lower bound 4x since the GFC ('08 it happened many times, Jan '18, this yr in July/Aug, Nov/Dec). As illustrated this usu is short lived. why would it be different this time? ...
Read 23 tweets
22 Nov 20
#stockmarket Last WE update I discussed dialing back on equities & despite + vaccine news the #SPX was down .77% for the wk. Risk still remains to the downside IMO, although can't be too bearish until we break the ranges. $SPY flag or lower high? ...
#stockmarket marked white circles (above) are showing heavy volume distribution days since Sept is not bullish. But for now the supply is getting absorbed. The Demark chart shows Day 2 of a price flip down following the completed 9-13-9 sell, and closed <5day EMA....
#stockmarket On the flip side, if $SPY can take out this flag to the upside, Demark propulsion up is active w/ a $390 tgt. If that happens, I would first measure any move w/ trend factor projections (367.44, 376.40, 385,37 - see red boxes)...
Read 16 tweets
15 Nov 20
#StockMarket WE update. crazy wk. Caught many offsides who were overloaded in tech. I suspect mkt leadership has shifted although it won't be linear. I am growing cautious & increasing hedges. As posted re #SPX last wk, Demark rare 9-13-9 sell printed w/ slo sto neg divergence...
#StockMarket #SPX here is another rarity & one for the bears, Demark 9-13-9 sell is also printing on the yearly chart, which has taken 40+ years to form. Not sure how to trade this but interesting nonetheless...
#stockmarket equally fascinating is that the #nasdaq is doing the same w/ a Demark 9-13-9 sell on the yearly. This in combination w/ the Demark combo & seq 13 sell on the weekly (combo printed last wk). Last time combo 13 sell printed here was the wk of Feb 20th. yikes!..
Read 21 tweets

Did Thread Reader help you today?

Support us! We are indie developers!


This site is made by just two indie developers on a laptop doing marketing, support and development! Read more about the story.

Become a Premium Member ($3/month or $30/year) and get exclusive features!

Become Premium

Too expensive? Make a small donation by buying us coffee ($5) or help with server cost ($10)

Donate via Paypal Become our Patreon

Thank you for your support!

Follow Us on Twitter!