Todays swabs are not good news, Tuesday is the low of the week so that 520 is 137% of last Tuesday's swabs continuing a suggested that rate of increase is accelerating & heading now for 4,000 cases a day by June /1
546 positive swabs on average over last 3 days are 121% of same days last week - if that continues
663 wk1
805 wk2
977 wk3
1187 wk4
1441 wk5
1750 wk6 - May 4th
2125 wk7
2581 wk8
3134 wk9
3806 wk10 - June 1st
4622 wk11
5613 wk12
6817 wk13
/2
Sunday & Mondays swabs only became available this morning, I look at them in this thread. Comparing these 7 days withy previous 7 reactions slower to change, thats showing these 7 days as 108% last 7 now, up from 105 yesterday
Taking that current 7 days being 108% of previous 7 days rate and projecting forward gives 1300 cases a day by June
633 wk1
684 wk2
740 wk3
800 wk4
865 wk5
935 wk6 - May 4th
1011 wk7
1094 wk8
1183 wk9
1279 wk10 - June 1st
1383 wk11
1495 wk12
1617 wk13
/4
Last nights NPHET press conference had a 9% week on week increase but the change between week 9 & week 11 was +29%. The concern has to be this is the increase that came from everything around the return to in person teaching even if that transmission is not happening in schools/5
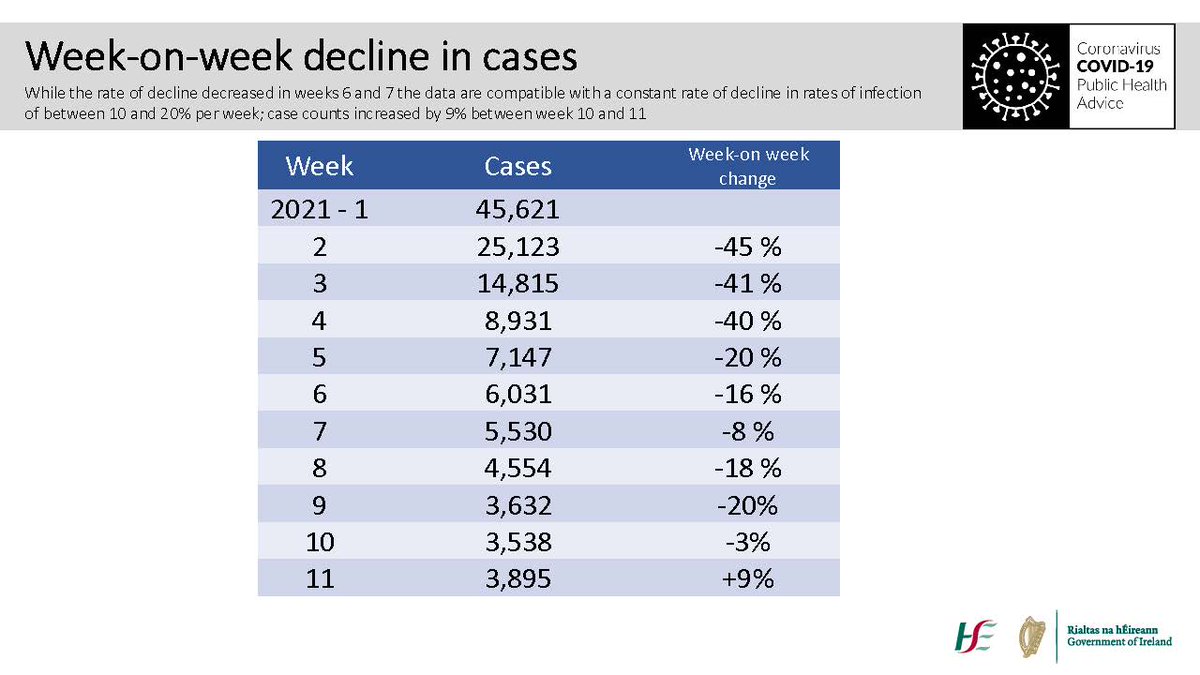
This slide for wk10 is too early to show impact of phase 1 of schools opening transmission properly but still the case when you remove households those 2 education categories outbreak percentages are greater than workplaces & comparable to extended family visits /6
Useful to also see that testing in schools are increased substantially so at least some of the age specific increase is probably cases that would previously have been missed /7
The GP referral data for Monday is very alarming. I've circled previous Monday's & this Monday is twice or more that of every previous Monday in March for Clinically Likely Covid19. @gpbuddy has proved a very accurate advance warning of significant change in recent months /8
The scale of then xmas disaster had 2 causes
1. The decision to open 'restaurants' against public health advice at 3 times the cases
2. But 60% of the consequences was failure to act quickly after it became clear Dec16 that cases were rising. If the data is bad act fast
Restaurants were left open for 9 more days & no call made to cancel xmas plans. Both of those would have been enormously unpopular in late December but would probably have saved 1300 lives and 5000 hospitalisations as well as a 3 month lockdown leading to where we are now
To be fair to Holohan he broke ranks on Dec & tweeted that restaurants were not safe. That resulted in the restaurant lobby, Fianna Fail politicians and the media calling on him to be muzzled. Then in late January they claimed 'no body warned us' /14
If you are new to the swab figures and wondering why there were only 371 cases today (106% of last week) this thread explains the relationship between positive swabs and case notifications.
There was a daily substantial under report today of 150, typically 130 of those would get notified as cases and added in the following days.
Paul Reid reporting a substantial increase in swabs collected Monday but not the doubling from the GP referral data - this would put us more in line for 750+ swabs this afternoon

• • •

Missing some Tweet in this thread? You can try to force a refresh
 

Keep Current with Andrew Flood 👨🏻‍💻📝🕺

Andrew Flood 👨🏻‍💻📝🕺 Profile picture

Stay in touch and get notified when new unrolls are available from this author!

Read all threads

This Thread may be Removed Anytime!

PDF

Twitter may remove this content at anytime! Save it as PDF for later use!

Try unrolling a thread yourself!

how to unroll video
  1. Follow @ThreadReaderApp to mention us!

  2. From a Twitter thread mention us with a keyword "unroll"
@threadreaderapp unroll

Practice here first or read more on our help page!

More from @andrewflood

23 Mar
Sunday & Mondays swab data is now available, confirming numbers of positive swabs are rising & potentially the rate of rise is increasing
Sunday 611 positive swabs, 4.11% positivity, 97.6% of last Sunday
Monday 506 positive swabs, 3.98% positivity, 148% of last Monday
/1
598 positive swabs on average over the last 3 days - a 117% rise on the same days last week, That rate would have us on 2800 a day by June 1st
698 wk1
816 wk2
953 wk3
1113 wk4
1300 wk5
1518 wk6 - May4
1773 wk7
2071 wk8
2419 wk9
2825 wk10 - Jun1
3299 wk11
/2
Last 7 days 3956 positive swabs against 3755 of the 7 before - 105% of last week. Thats less alarming a rate of increase - next 2 days should show which applies
wk1593
wk2623
wk3654
wk4687
wk5721
wk6757 - May4
wk7795
wk8835
wk9877
wk10921 - Jun1
wk11967
/3
Read 7 tweets
19 Feb
Last nights NPHET upload included 4 now deleted slides illustrating that as vaccine is rolled out Ireland will remain vulnerable to significant surges in cases, the worst projection being more than Dec/Jan wave, peaking at over 10k per day. They assume vax complete by October /1
Slides are headed 'A Vulnerable period ahead' & illustrate a possibility of repeated surges & lockdowns, assuming 58,800 vaccinations per week. 85% efficacy green line has just two future surges & lockdowns, another (0 efficacy?) just repeats /2
The most alarming one where R value is assumed to rise to 2 has a surge so enormous it vanishes off the top of the graph as it passed 10,000 cases. Looks to be a peak around 18k. Presumably these are 'look lads, despite vaccination you can still really feck this up' warning /3
Read 8 tweets
19 Feb
836 positive #Covid19Ireland swabs which is 85% of last Friday. Positivity below 5% for first time in a while at 4.9%. Still looking at a very long (3 months) reduction in cases to get us under 100 per day /1
Average positive #Covid19 swabs over last 3 days was 863, thats 88% of same days last week, that rate projected
760 wk1
669 wk2
588 wk3
518 wk4
456 wk5
401 wk6
353 wk7
311 wk8
273 wk9
241 wk10
212 wk11
186 wk12
164wk13
/2
Drastic reduction in rate new cases falling at now attributed to rising proportion of #B117 - 90% of cases in last two weeks. Older variants reduced 35%+ a week, B117 reducing at around 15%, thats difference between 2 month lockdown & 5 month lockdown to get under 100 a day /3
Read 9 tweets
19 Feb
Weekly deaths bulletin for northern Ireland has 2691 #Covid19Ireland deaths to February 12th. This weekly NISRA count is more exhaustive that the Department of Health daily announcements & running total. It had 1985 deaths at that date, 26% less /1
The future NISRA minimum number of total deaths for yesterdays can be reprojected by adding the 36 DoH deaths since Feb 12th to the 2691 NISRA total for the 12th to give 2727. The likely total is 2706 which is 1454 #Coronavirus deaths per million in northern Ireland /2
NISRA provide a calculation of excess deaths (those above the 5 year average) which is 2,475 since the start of the pandemic, 546 of those in 2021. Worth noting in passing this is a higher ratio than the CSO in the south which may reflect south capturing more covid deaths? /3
Read 6 tweets
18 Feb
816 #CovidIreland positive swabs are 95% of last Thursday so very slow rate of reduction continues which means under 100 cases a day is month away. #B117 variant seems to be cause of slowdown with 25% of close contacts being infected now as against 12%. 5.26% positivity /1
Average of 842 positive swabs over last 3 days, this is 91% of same days last week. Week on week reductions at that rate runs into June to go under 100
766 wk1
698 wk2
635 wk3
579 wk4
527 wk5
480 wk6
437 wk7
398 wk8
362 wk9
330 wk10
300 wk11
273 wk12
249
/2
HSE report of number of close contacts of confirmed cases remains pretty static so this isn't the cause of the slowing down but a much higher proportion of these now test positive probably due to B117. Note NPHET give a lower adult only figure on Thursday evening /3
Read 5 tweets
17 Feb
938 positive swabs, up[ ass usual on Tuesday but 86% of last Wednesday, continuing the pattern of very much reduced rate of decrease. Positivity at 5.5% slight improvement on yesterday but still too high. At this rate 14 weeks to get under 100 a day /1 Image
Average positive swabs of last 3 days is 785, 87% of the same days last week. At that week on week rate
686 wk1
600 wk2
525 wk3
459 wk4
401 wk5
351 wk6
307 wk7
268 wk8
235 wk9
205 wk10
179 wk11
157 wk12
137wk13 - 19th May
/2
This rate of decrease is again similar to that of Northern Ireland which for the last couple of weeks has also had a very similar 7 day incidence rate - perhaps for once we won't be in a situation with radically difference rates each side of the border /3
Read 8 tweets

Did Thread Reader help you today?

Support us! We are indie developers!


This site is made by just two indie developers on a laptop doing marketing, support and development! Read more about the story.

Become a Premium Member ($3/month or $30/year) and get exclusive features!

Become Premium

Too expensive? Make a small donation by buying us coffee ($5) or help with server cost ($10)

Donate via Paypal Become our Patreon

Thank you for your support!

Follow Us on Twitter!