🤓 heard the one that there are few ongoing jobs in renewables?

turns out it's nonsense.

@UTSISF's detailed 2020 report, based on AEMO projections, shows the renewables sector provides a good and growing number of good, secure & regional jobs… 🧵

uts.edu.au/research-and-t…
RE sector has 2 arms — construction and operations.

construction jobs will continue for decades. currently construction outnumbers operations, but as fleet grows operations becomes the majority.

i added the red line, coal power jobs.

RE already employs more than coal power.
(this chart does not include jobs in building new 'poles and wires', bioenergy, professional services, renewable hydrogen, mining inputs for RE [e.g. nickel, lithium, cobalt, rare earths] or industrial expansion arising from comparative advantage in energy-intensive industries.)
currently in australia, coal power generates ~twice as much energy as renewables.

…and coal power employs ~twice as many _ongoing_ jobs as renewables.

in ~5 years when renewables match coal power generation, the number of ongoing jobs in both sectors will be ~equal.
…and by the early 2030s, ongoing jobs in RE will eclipse jobs in coal power.

the charts following are for the whole sector — construction & operations.

here are the skills required (as percentage).

these are _good_ jobs.
…and ~2/3 of the jobs are regional jobs:
…and these new jobs are created in new areas.

(nb. the scales for the two maps are different, so the darkest colour on fossil fuel map represents 1000–2000 jobs, while the darkest colour on the RE jobs map represents 7000–12000 jobs. ie. ~6x as many for the same colour.)
so, please keep this thread handy… the next time someone tells you there aren't many jobs in renewables, you can be confident that:

there are already more jobs in RE than coal power in australia, and will soon be more _ongoing/operations_ jobs.

h/t @UTSISF / @seamonkyzzz

• • •

Missing some Tweet in this thread? You can try to force a refresh
 

Keep Current with 💧simon holmes à court 🕯

💧simon holmes à court 🕯 Profile picture

Stay in touch and get notified when new unrolls are available from this author!

Read all threads

This Thread may be Removed Anytime!

PDF

Twitter may remove this content at anytime! Save it as PDF for later use!

Try unrolling a thread yourself!

how to unroll video
  1. Follow @ThreadReaderApp to mention us!

  2. From a Twitter thread mention us with a keyword "unroll"
@threadreaderapp unroll

Practice here first or read more on our help page!

More from @simonahac

18 Apr
🤓@ScottMorrisonMP's fossil gas announcement today is a poke in the eye for @ClimateEnvoy and @POTUS.

morrison claims south australia needs the gas for cheap, reliable power.

let's take a little look at SA's use of gas for power generation… 🧵

theguardian.com/australia-news…
over the past 12 months fossil gas provided 37% of south australia's electricity — a higher proportion than any other state.

(SA completely phased out all coal in 2016 and doesn't have any significant hydro resources.)
if we zoom out to the last 2 decades, we can see the important but *reducing* role gas has played in SA's generation mix.
Read 8 tweets
17 Mar
10 march: #victoria announces deal to subsidise #coal power station to stay operating.

17 march: #victoria introduces legislation to add a ~$5000 tax on electric vehicles.

🚗🔋➡️💸➡️🏭

taxing climate solutions & subsidising coal.

welcome to the upside down. #springst #auspol
$330/year x 15 years = $4,950

the new MG ZS EV costs $43,990 on the road.

ie. #victoria's new #EV tax works out to be about 11%.

…buy an #EV in victoria and pay more in #EV tax than GST.
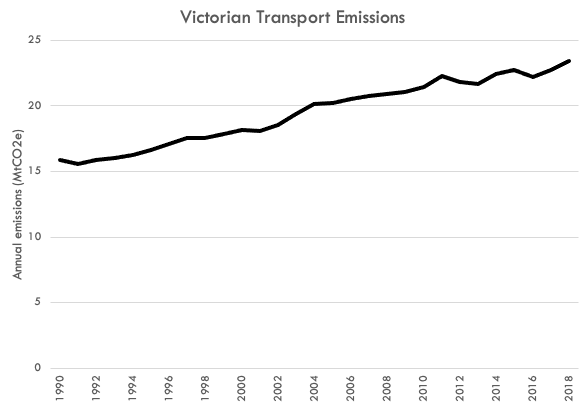
with #EVs at 0.7% market share and #victoria's transport emissions rising…

now is the *worst* time to slap on an 11% #EV tax.
Read 4 tweets
6 Mar
🤓@senbmckenzie facts are important…

while there's an immense amount of energy in all matter — E=mc² and all that — we *don't* have technology to get a lifetime's energy for a person out of a golfball sized lump of uranium.

since we can't rely on @MineralsCouncil, a thread:
if you did want to power an average australian's lifetime energy needs from uranium, what would it take? 🧐

…by a couple of different methods (link at end), i estimate that 2.1GWh would cover all the energy needs of an average australian lifetime, assuming full electrification.
working back from this handy chart from @WorldNuclear, in the best case you'd need 417cc of nuclear fuel (mainly UO₂) for a single australian's lifetime.

but how do you get that? read on…

world-nuclear.org/information-li… Image
Read 15 tweets
30 Jan
🧵 my theory is that everybody knows they're being lied to, but few have the time to find out just how. i'm here to help.

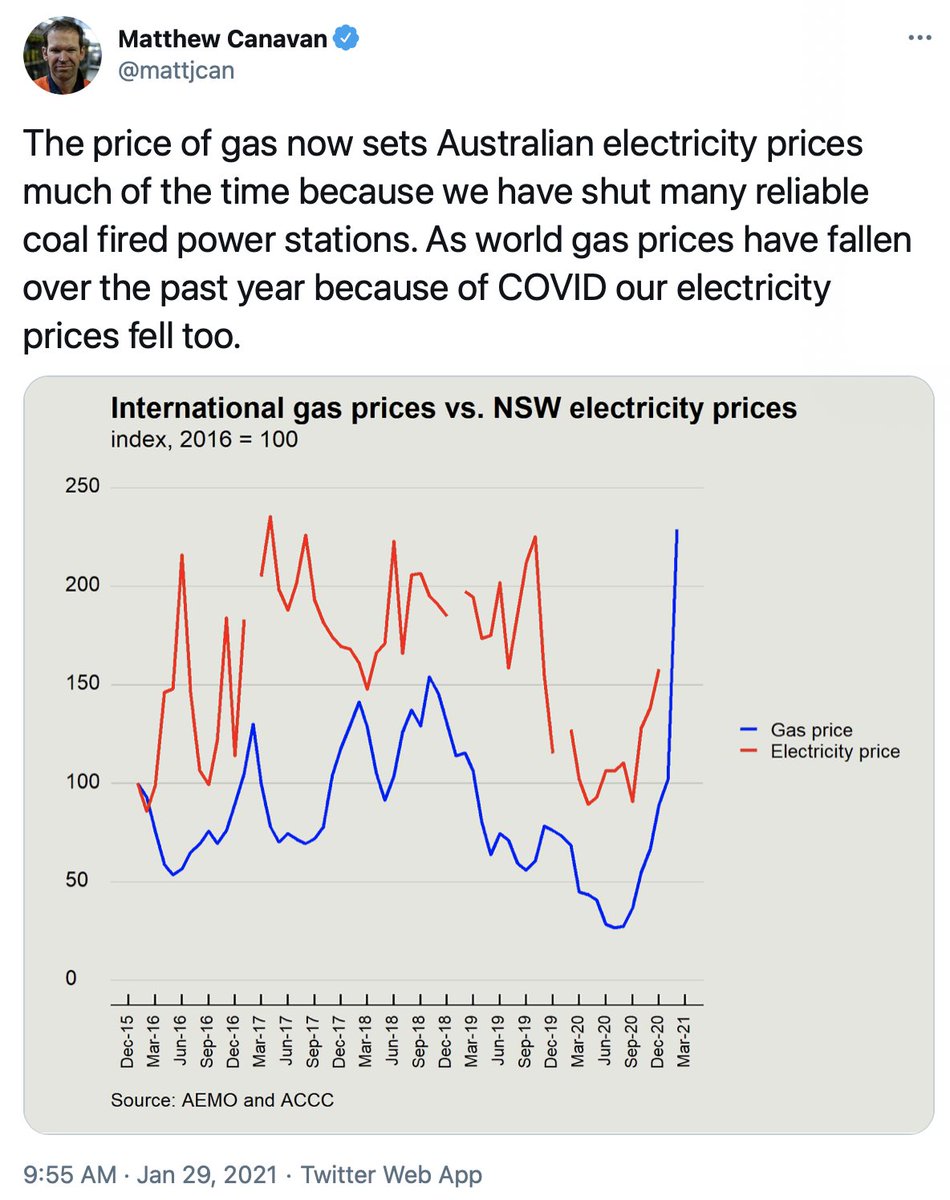
here's how @mattjcan🤥 is lying to you:

#1. he says "gas _now_ sets australian electricity prices". the truth is it has for years…
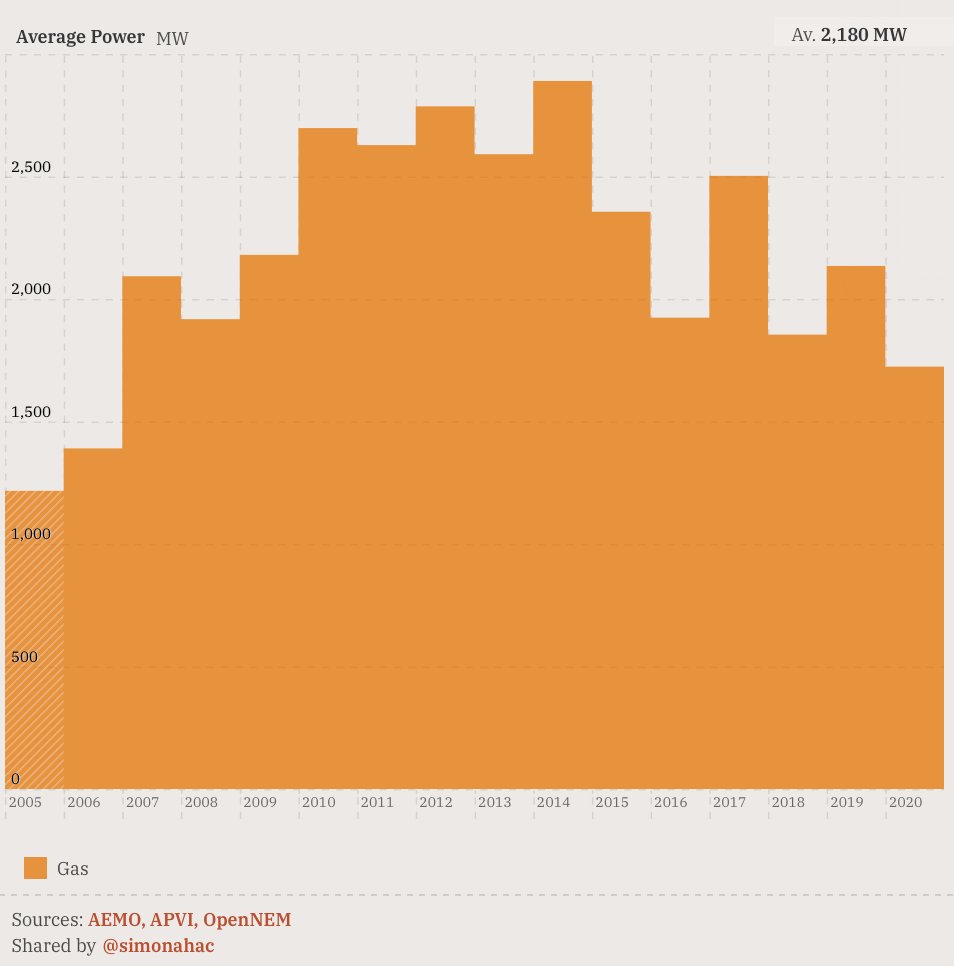
…gas generation in the NEM hit a 15 year low last year, yet it still plays a major role in setting the price.

why? because coal and hydro plants "shadow price" gas.

ie. they set their bids just below the cost of gas to maximise their profits.

see
#2. @mattjcan🤥 tries to make a connection between rising gas prices and blackouts in sydney.

that's just soooo wrong!

these blackouts were due to problems in the distribution network ("poles and wires").

there have been no incidents of load shedding in NSW recently.
Read 8 tweets
27 Jan
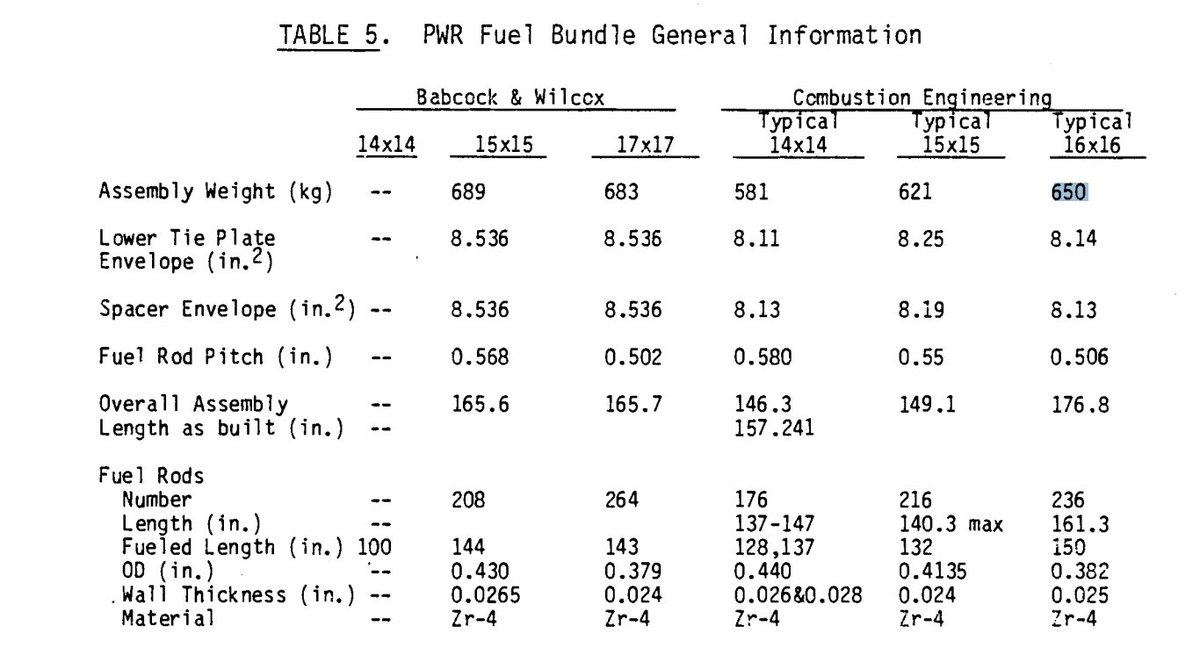
#nuclear twitter: super niche question, but i'm trying to find out the mass of fuel in a CE 16x16 assembly (such as used by palo verde).

this ancient doc claims the assembly weighs 650kg, but of course, only part is fuel.

osti.gov/servlets/purl/… Image
a nuke expert i consulted provided this estimate based on the spec sheet above:

ie. 551 kg/assembly Image
that estimate looks pretty good… though it ignores the pellet's dimples and chamfers, and the gap between pellet and cladding.

anyone have actual data? 🙏

@energybants @whatisnuclear @6point626 @Gen_Atomic ImageImage
Read 4 tweets
15 Dec 20
ok @DaveSharma i promised i'd explain why your tweet is nonsense & why you shouldn't repeat it.

👇here's #australia vs #newzealand relative emissions since 2005:
• australia ⬆️ 6%
• new zealand ⬇️ 3%

(you'll notice that LULUCF is excluded…)
why is LULUCF (land-use, land-use change & forestry) excluded?

1. measurement methodologies aren't standard between countries & frequently change — no robust method to compare countries
2. annual fluctuations are high / noisy

data: PRIMAP-hist v2.1
pik-potsdam.de/paris-reality-…
3. the vast majority of australia's LULUCF variation is driven by changes to QLD land-clearing laws, a function of state political tussles, and nothing to do with commonwealth policy.
4. australia is famous for using LULUCF as a fudge, see @MichaelM_ACT:

medium.com/@MichaelM_ACT/…
Read 8 tweets

Did Thread Reader help you today?

Support us! We are indie developers!


This site is made by just two indie developers on a laptop doing marketing, support and development! Read more about the story.

Become a Premium Member ($3/month or $30/year) and get exclusive features!

Become Premium

Too expensive? Make a small donation by buying us coffee ($5) or help with server cost ($10)

Donate via Paypal Become our Patreon

Thank you for your support!

Follow Us on Twitter!

:(