Vibrant Clean Energy Profile picture
May 28, 2021 15 tweets 13 min read Read on X
We released a report yesterday w/ @350Montana & @GridLabEnergy on "Affordable & Reliable
Decarbonization Pathways for
Montana." Here is a short thread...
First, report is here: vibrantcleanenergy.com//wp-content/up…

Second, Exec summary is here: vibrantcleanenergy.com//wp-content/up…

Third, More can be found @350Montana: 350montana.org/2021/05/27/the…
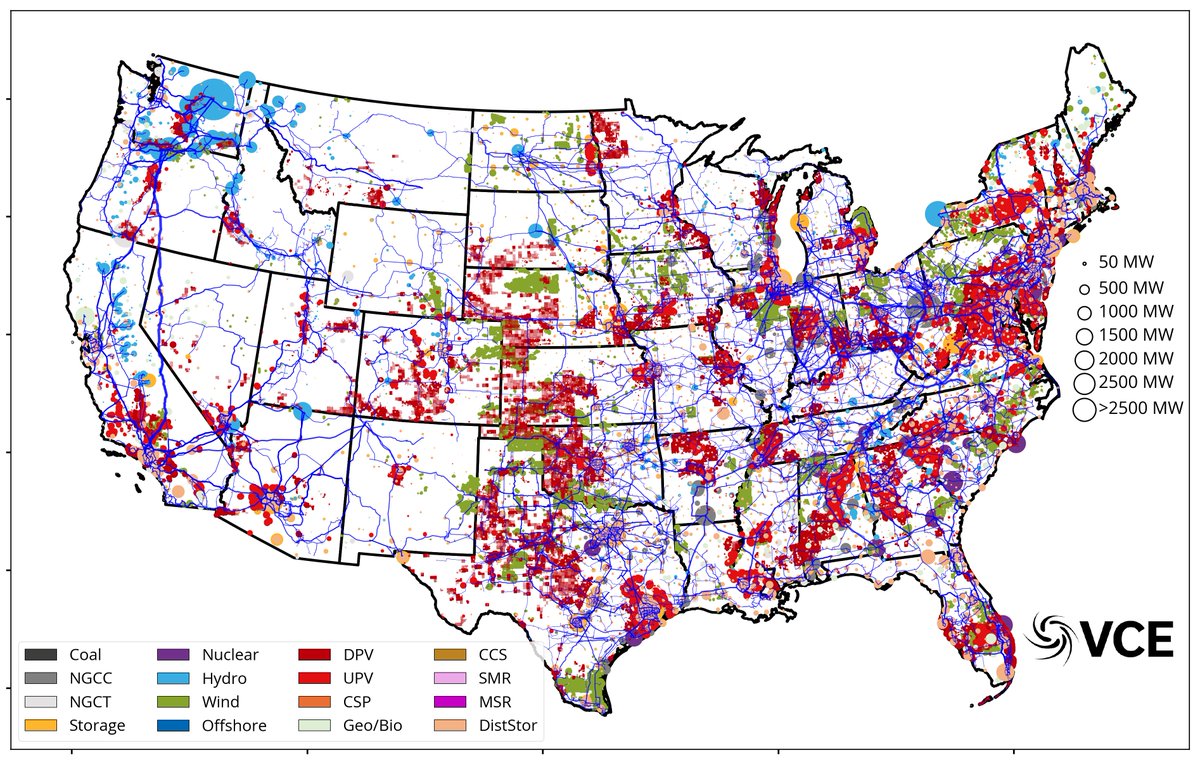
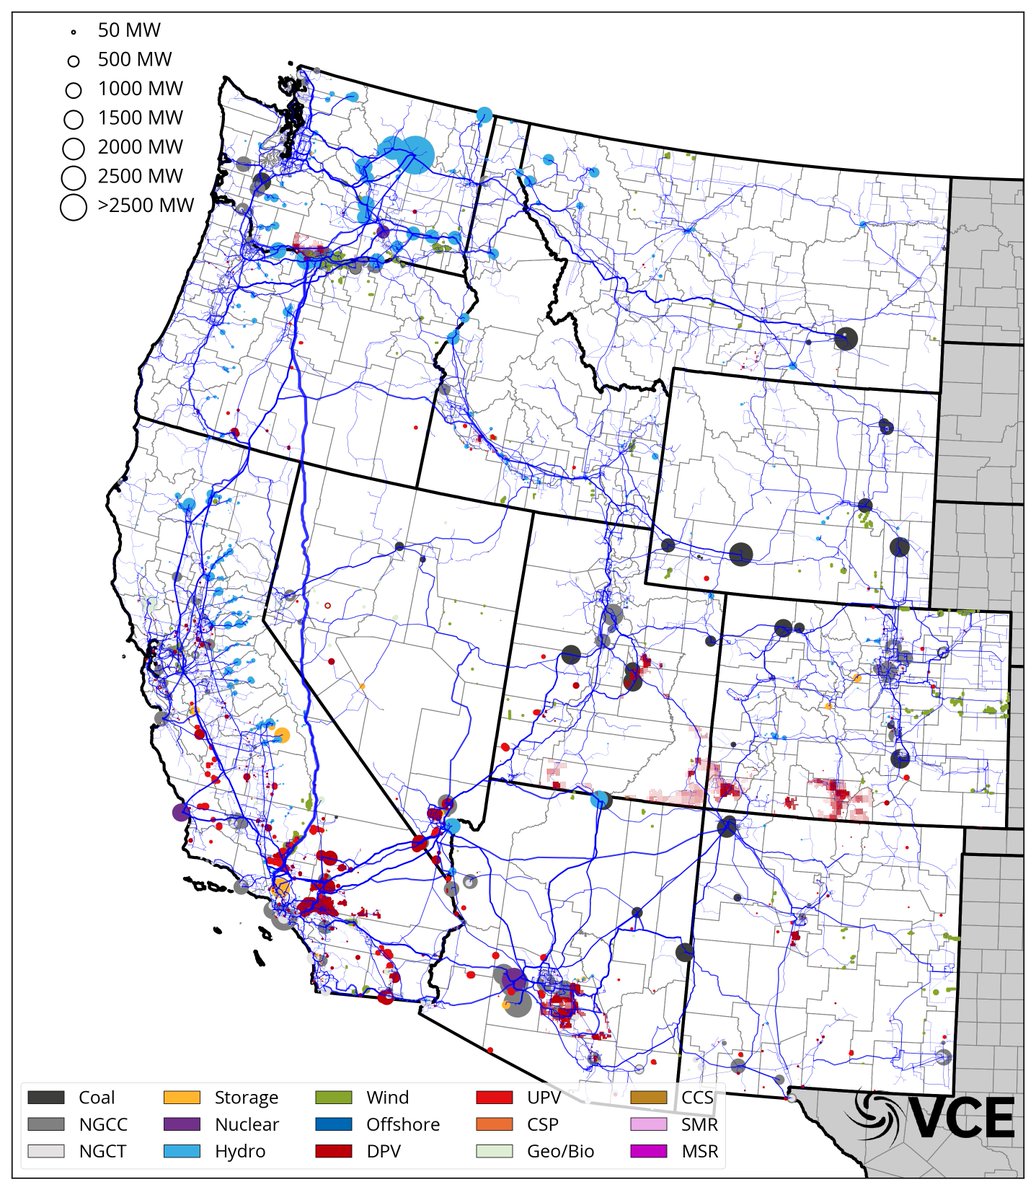
We performed five scenarios for the MT #grid. Long-story-short, the MT grid can run #reliably without #coal or #naturalgas & become 100% #renewable by 2035. MT still needs import/exports w/ other regions; but exports far more than imports. Image shown is 2050.
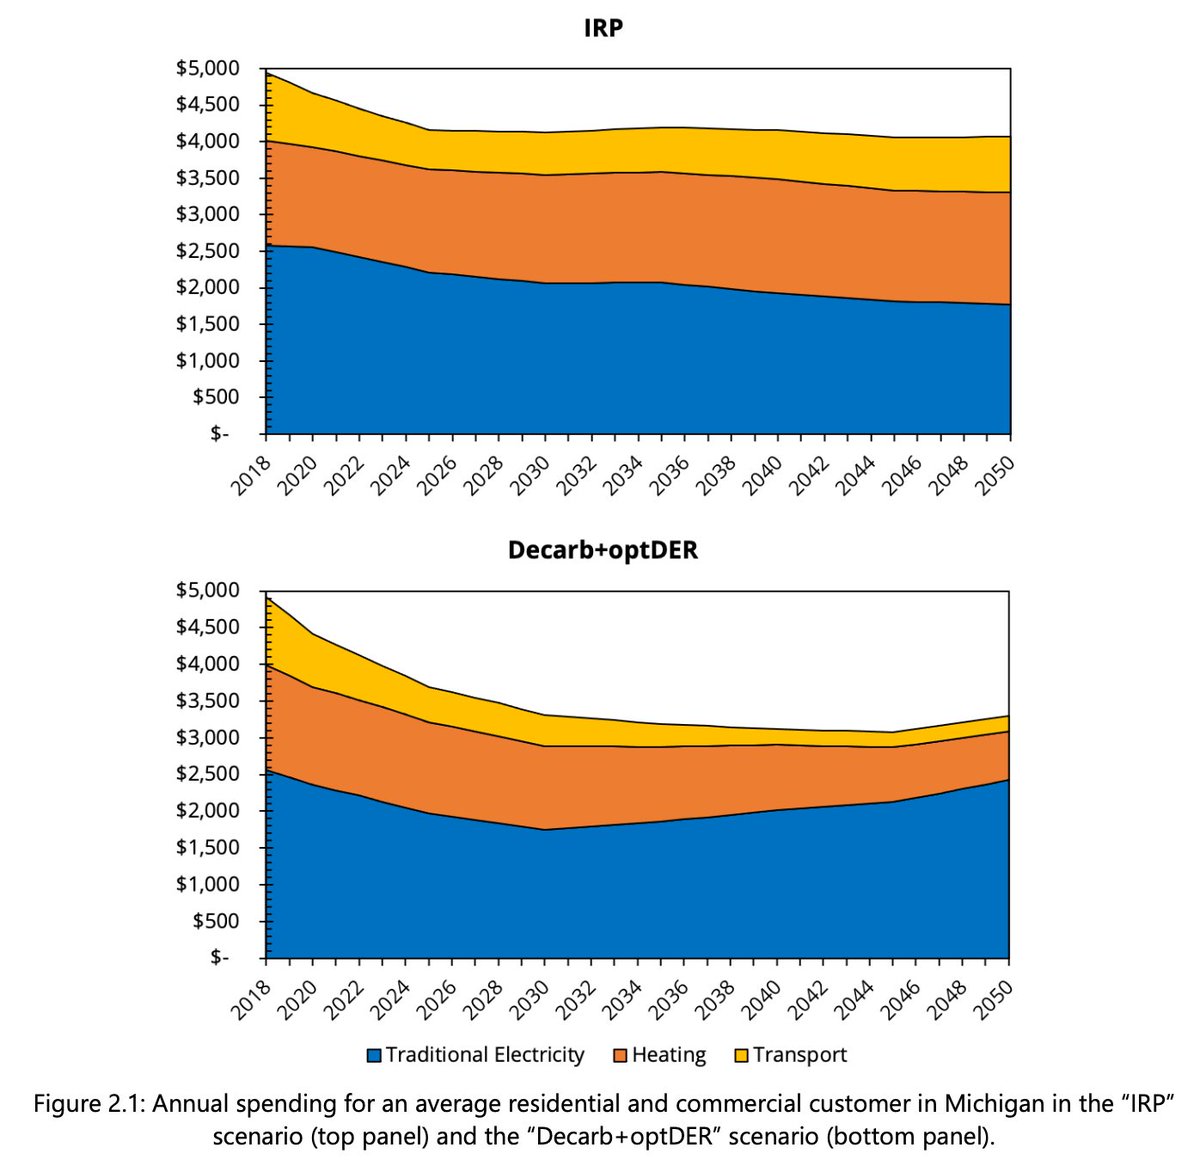
The 5th scenario was most interesting to us because we electrified the economy by 2050, so that there was a zero emission economy. This meant more demand, different demand profiles, and new considerations!
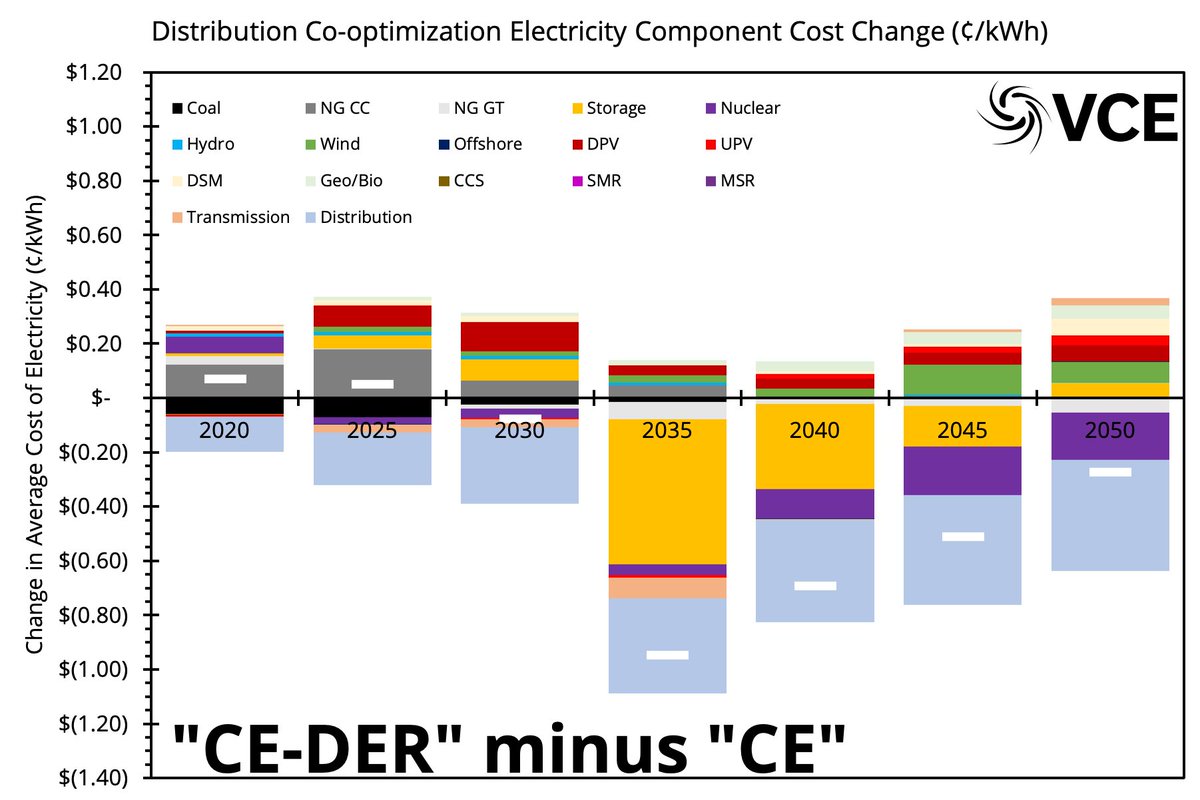
We found that there were savings to be had across these different sectors when electrifying. Most importantly, the reduction benefits all, not just those that electrify because rates fall faster with electrification; reducing the energy burden for all of those in Montana.
This cumulates across the system and becomes a $34 billion saving through 2050. These savings pass through to the customers at a rate of more than $2,500 per year (if fully electrified).
The modeled systems show huge growth in #wind, #solar, #storage. The electrified economy also needs #hydrogen for agriculture and other uses.
This huge growth in capacity adds to in-state (MT) jobs. Roughly doubling by 2050 from 2020 levels.
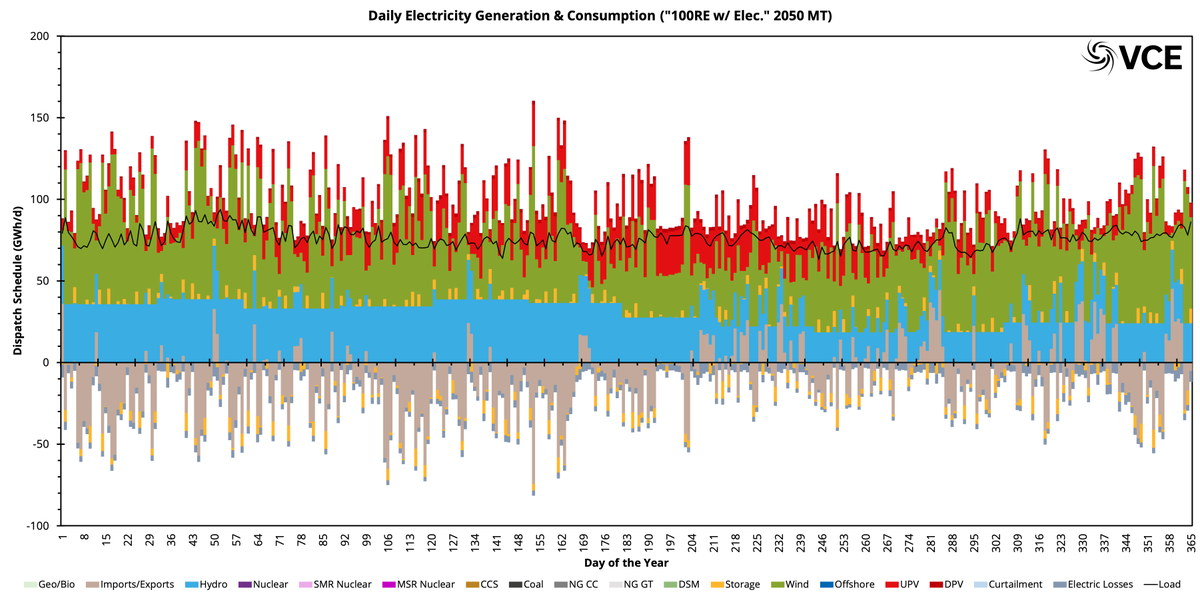
We modeled the whole of the Western United States simultaneously with Montana because of the substantial exports that it currently provides. We found that the whole system is kept in balance over every 5-minute interval through 2050 under all the scenarios.
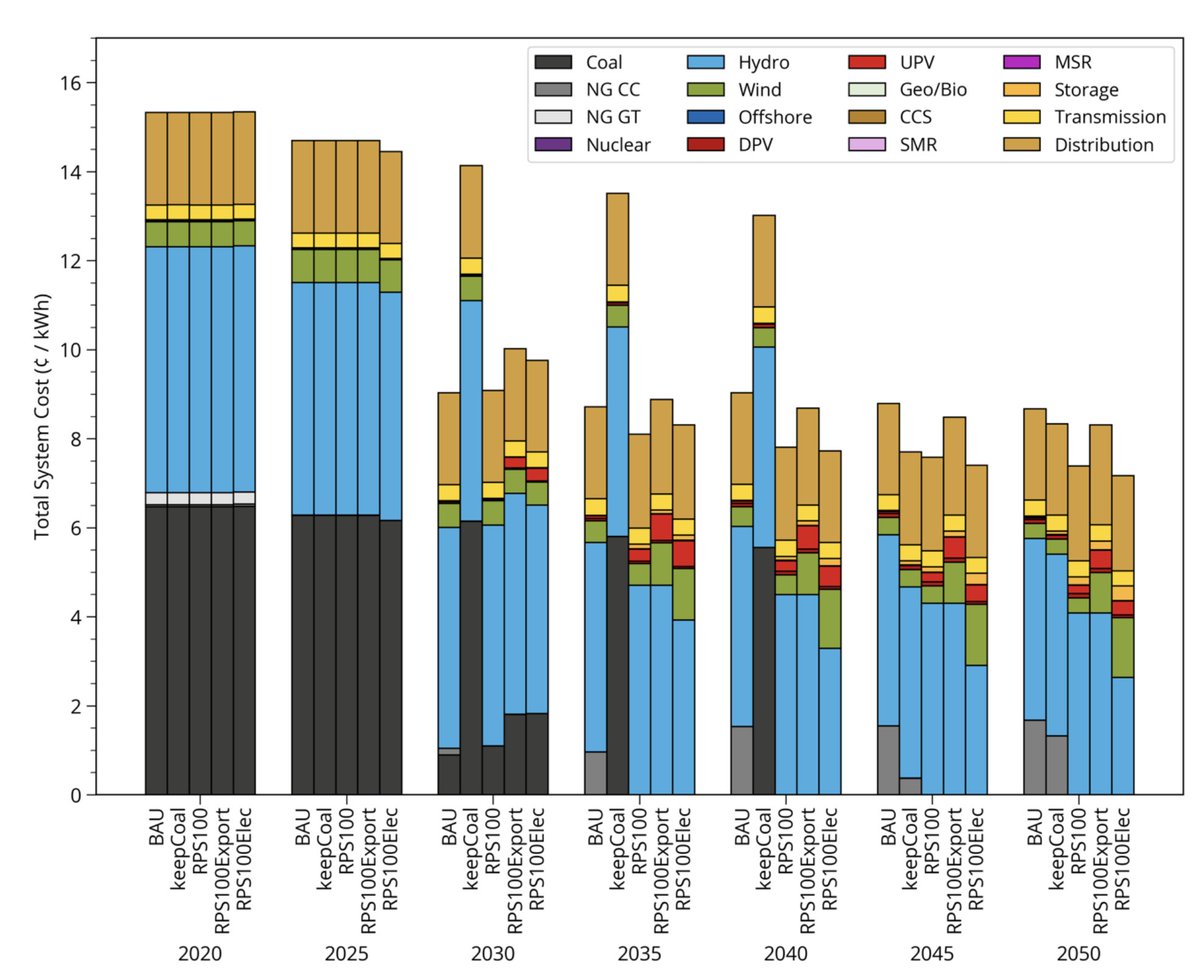
The whole of the Western US undergoes huge changes between 2020 and 2050. There is no coal left (by 2035) and about the same NG as today. Massive increases in wind (40GW), solar (63GW) and storage (23GW +4hr) across the region. These other regions do not electrify fully.
When we consider the reliability, we ensure that each region has NO loss of load for any 5-minute window through 2050. Further, there is 7% load-following reserves and NERC recommended planning reserve margins. Here we show the most difficult period for MT in 2050.
Due to the different scenarios, we can carve out the benefits of each piece and see where the decarbonization "wedges" come from. By 2050m the cumulative GHG emissions avoided are over 600 million metric tons.
Much more can be found in our report: vibrantcleanenergy.com//wp-content/up…

Final comment is that retail rates fall over time and this is a consequence of moving to lower-cost resources that are balanced by storage, transmission and some hydroelectric (along with demand flexibility).
All high-level output data is provided on the VCE website for this study: vibrantcleanenergy.com/wp-content/upl…

• • •

Missing some Tweet in this thread? You can try to force a refresh
 

Keep Current with Vibrant Clean Energy

Vibrant Clean Energy Profile picture

Stay in touch and get notified when new unrolls are available from this author!

Read all threads

This Thread may be Removed Anytime!

PDF

Twitter may remove this content at anytime! Save it as PDF for later use!

Try unrolling a thread yourself!

how to unroll video
  1. Follow @ThreadReaderApp to mention us!

  2. From a Twitter thread mention us with a keyword "unroll"
@threadreaderapp unroll

Practice here first or read more on our help page!

More from @VibrantCE

Jun 21, 2022
🚨 #NewStudyAlert 🚨 #energytwitter

Today we release a new report: "Role of Electricity Produced by Advanced Nuclear Technologies in Decarbonizing the U.S Energy System". Below lies a thread (🧵🪡)
We deployed WIS:dom-P w/ augmentation to include: #endogenous learning, blended adv. #nuclear tech., yearly investment periods, @NREL #electrification, pilot projects, new #weather & load #datasets.
Two pathways were analyzed. First, "nominal", was where advanced nuclear had a lower first-of-a-kind (FOAK) cost & no delays due to permitting, labor, supply chains. The second pathway, "constrained", had a higher FOAK and there were delays in permitting, labor and supply chains.
Read 16 tweets
Feb 23, 2022
🚨NEW STUDY ALERT🚨

Today we release a new #study for @votesolar that looks at #electrifying and #decarbonizing #Michigan's #economy by 2050. A thread 🧵!

vibrantcleanenergy.com/media/reports/
We computed 3 scenario pathways:
1) Duplicated three utilities IRPs
2) Clean economy by 2050 using utility generation
3) Clean economy by 2050 using both utility & distributed generation (via co-optimization)
Main results (1)
Lower costs for customers ($773 p/a for res. + comm. & $70K p/a for industrial) compared with IRP.
Read 15 tweets
Feb 24, 2021
Here is a look at the #Texas Wind (avg over all state) for each month for last 175 years. It's the average capacity factor for each month. Our climate data suggests events like that of the last few weeks will occur ~4 more times before 2050.
Here is the same analysis for #solar across #Texas. Please note that these plots assume uniform installations across all of the state.
Here are the same plots, but weekly rather than monthly. More noisy, but we think useful!
Read 6 tweets
Dec 14, 2020
🚨⚡️FULL TECHNICAL REPORT RELEASED⚡️🚨

Today, we have released our full technical report on the "Why Local Solar and Storage Costs Less". Two weeks ago, we released the main findings: savings of $473 billion when co-optimizing distribution. This released provides more details!
The report, ES, summary presentation, and spreadsheet can all be found on our website: vibrantcleanenergy.com/media/reports/ #energytwitter #cleanelectricity
The full technical report shows that the cost savings comes from lower distribution spending and higher utilization of variable renewables. The additional costs of local solar and storage are much lower than the benefits unlocked. #energytwitter
Read 18 tweets
Dec 1, 2020
⚡️ NEW STUDY RELEASE (9:30 ET 12/1) ⚡️

Why Local Solar For All Costs Less:
A New Roadmap for the Lowest Cost Grid

A thread 🧵 - this study has been ~18 months in the making! @SolarAccess @Sunrun @TeamKivvit @LocalSolar4All @votesolar @DrChrisClack @achoukulkar @RabagoEnergy
We present four (of our 15) scenarios that show what DERs can do under BAU and a nationwide CES. We augmented our WIS:dom®-P modeling software during the course of the study to better represent the distribution grid. We did this using an interface (or event horizon)
Read 26 tweets
Oct 28, 2020
⚡️NEW STUDY RELEASE⚡️: Consumer, Employment, and Environmental Benefits of Electricity Transmission Expansion in the Eastern United States w/ @CleanEnergyGrid @gogginmichael @DrChrisClack. A short thread...
High-level: If the Eastern US aims for 95% GHG reduction by 2050 (65% by 2035) it could have 6 million new jobs, $100 billion reduced costs, and over 80% generation from wind and solar. How? This is enabled by new high-voltage transmission connecting everything together Interstate transmission buildout by 2050
Note that transmission and storage actually work together in a decarbonized grid because they provide complementary benefits. Storage provides temporal diversity and transmission provides geographic diversity. The sum of the two are greater than the parts.
Read 11 tweets

Did Thread Reader help you today?

Support us! We are indie developers!


This site is made by just two indie developers on a laptop doing marketing, support and development! Read more about the story.

Become a Premium Member ($3/month or $30/year) and get exclusive features!

Become Premium

Don't want to be a Premium member but still want to support us?

Make a small donation by buying us coffee ($5) or help with server cost ($10)

Donate via Paypal

Or Donate anonymously using crypto!

Ethereum

0xfe58350B80634f60Fa6Dc149a72b4DFbc17D341E copy

Bitcoin

3ATGMxNzCUFzxpMCHL5sWSt4DVtS8UqXpi copy

Thank you for your support!

Follow Us!

:(