Can the 50-Week EMA save the #BTC Bull Market?
A thread on why the 50 EMA is worth paying attention to...
#Crypto #Bitcoin
A thread on why the 50 EMA is worth paying attention to...
#Crypto #Bitcoin
1.
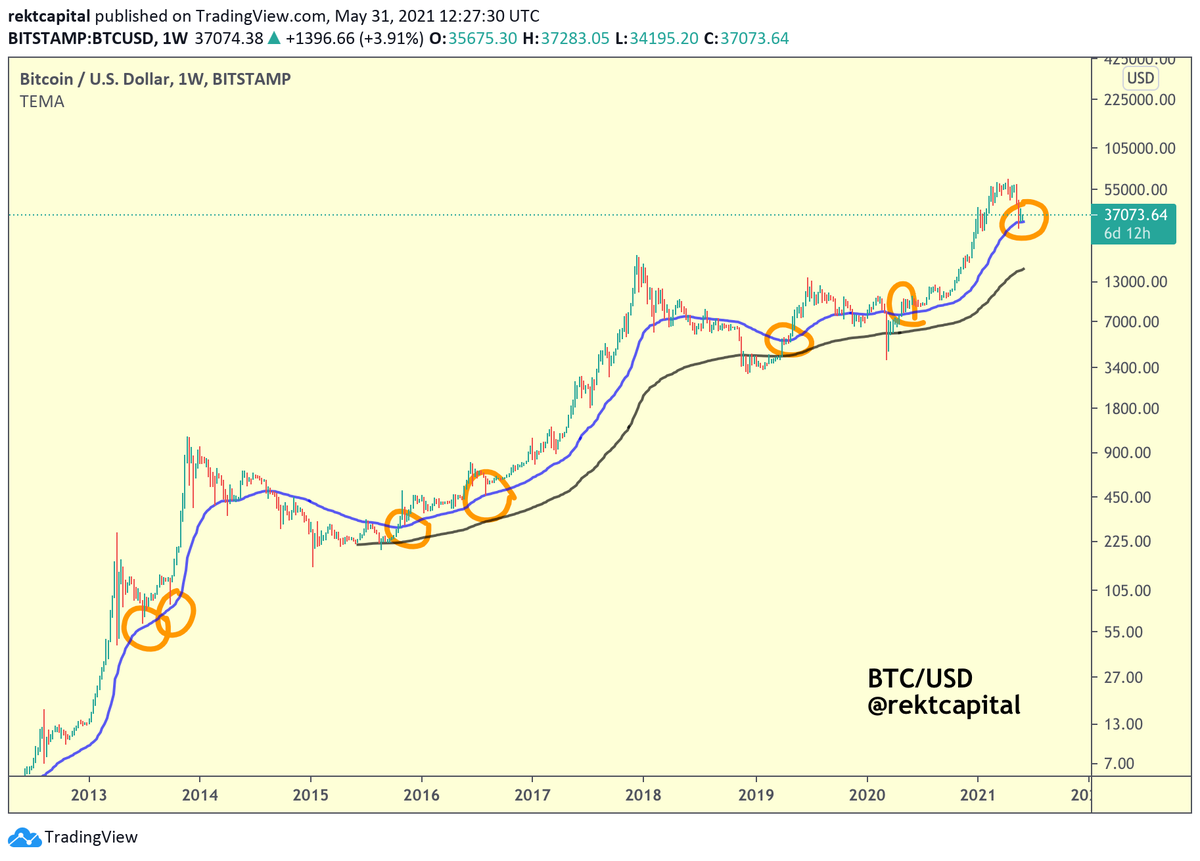
The 50 EMA (blue) and the 200 EMA (black) are integral parts of any Golden Cross or Death Cross on the Daily timeframe
On the Weekly timeframe however, these two EMAs run alongside in parallel, never actually crossing over
The 50 EMA (blue) and the 200 EMA (black) are integral parts of any Golden Cross or Death Cross on the Daily timeframe
On the Weekly timeframe however, these two EMAs run alongside in parallel, never actually crossing over

2.
Historically, the 50 EMA figures as a valuable support across #BTC Bull Markets
Whenever support is kept at the 50 EMA, the #Bitcoin Bull Market continues
Historically, the 50 EMA figures as a valuable support across #BTC Bull Markets
Whenever support is kept at the 50 EMA, the #Bitcoin Bull Market continues
3.
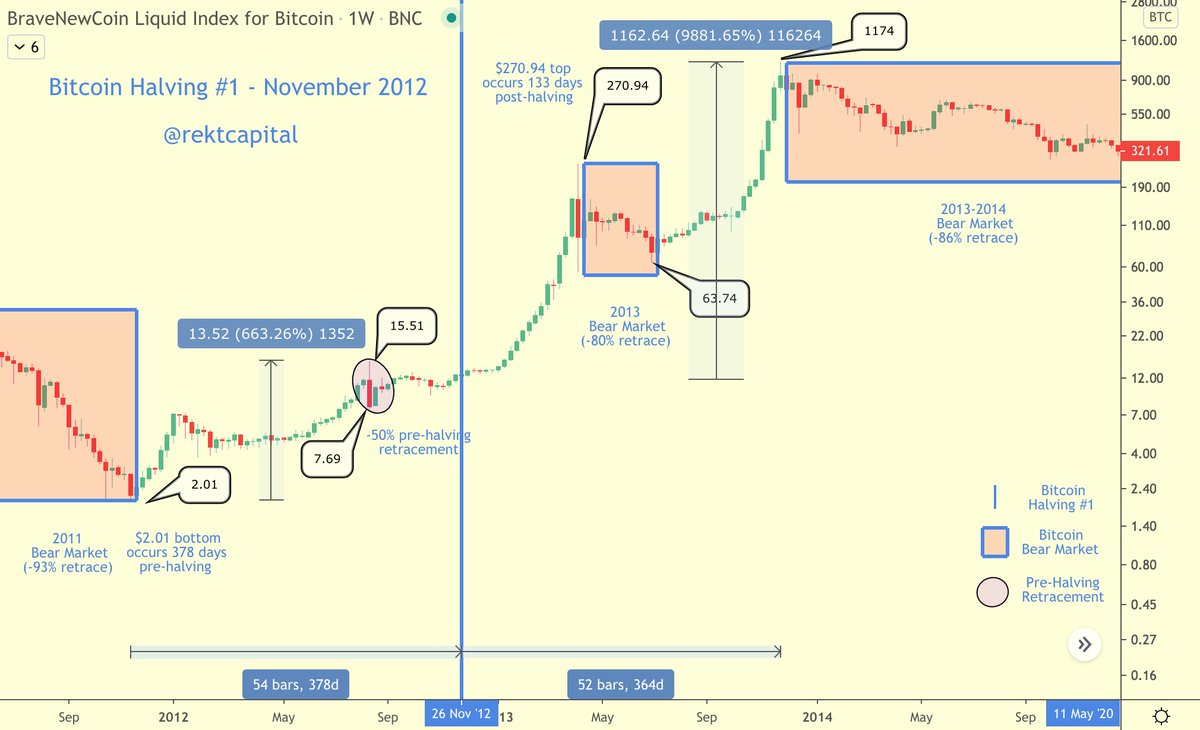
The 2013-2014 Bull Run is a great example of how #BTC can experience a deep, devastating crash but still maintain the 50 EMA as support
Though $BTC doesn't actually touch the 50 EMA on the crash, this EMA proved useful in preserving the bullish momentum after the crash
The 2013-2014 Bull Run is a great example of how #BTC can experience a deep, devastating crash but still maintain the 50 EMA as support
Though $BTC doesn't actually touch the 50 EMA on the crash, this EMA proved useful in preserving the bullish momentum after the crash

4.
Once the #BTC Bear Market begins, the 50 EMA briefly figures as support for relief rallies (red box)
But these relief rallies offer limited upside & ultimately, the 50 EMA is later lost
In fact, the 50 EMA turns into a resistance, only to reject #Bitcoin to lower prices
Once the #BTC Bear Market begins, the 50 EMA briefly figures as support for relief rallies (red box)
But these relief rallies offer limited upside & ultimately, the 50 EMA is later lost
In fact, the 50 EMA turns into a resistance, only to reject #Bitcoin to lower prices
5.
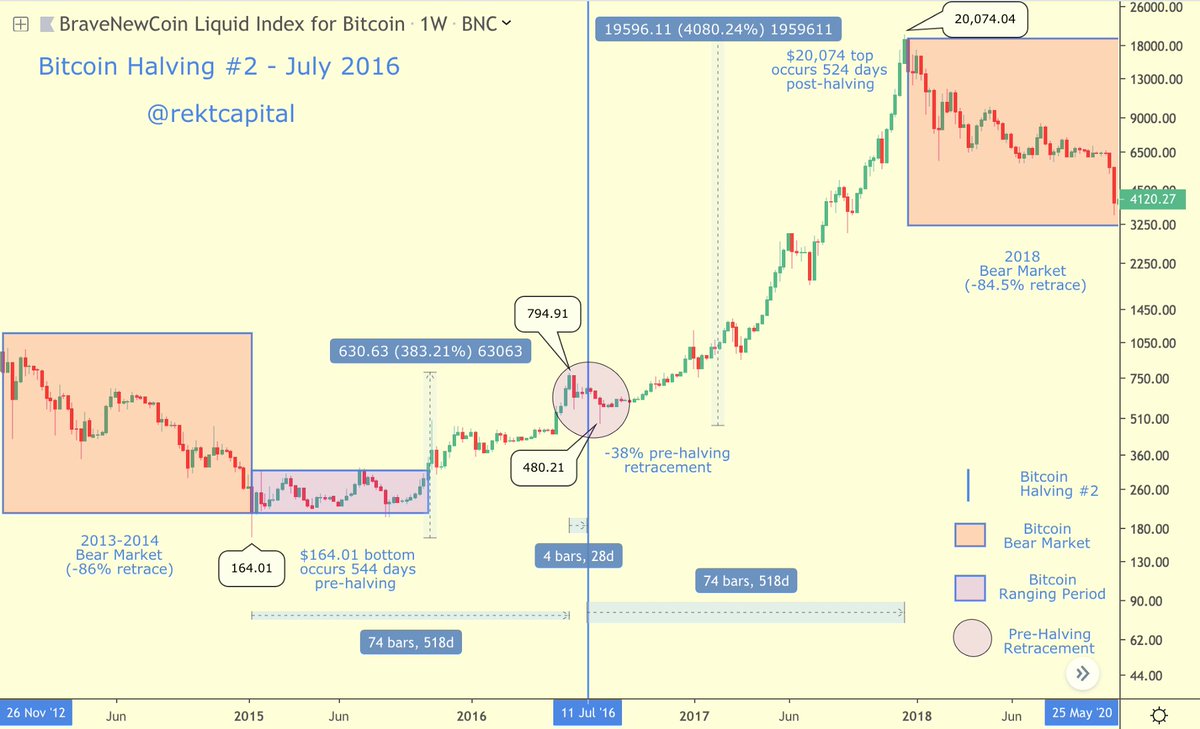
During Bear Market bottoms, the 200 EMA (black) proves useful
Green area highlights how the 200 EMA figures as a support & offers an outsized financial opportunity for #BTC investors
$BTC then reclaims the 50 EMA (blue) as support to confirm a new Bull Market
During Bear Market bottoms, the 200 EMA (black) proves useful
Green area highlights how the 200 EMA figures as a support & offers an outsized financial opportunity for #BTC investors
$BTC then reclaims the 50 EMA (blue) as support to confirm a new Bull Market
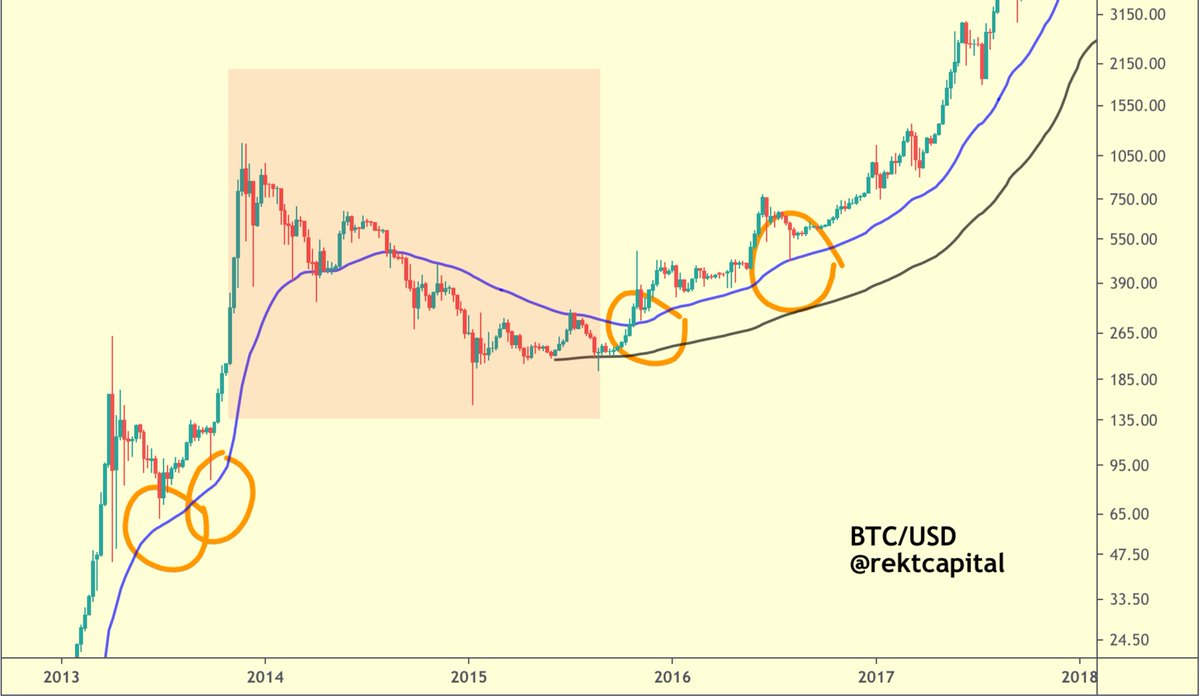
6.
Once again, breakouts above the 50 EMA precede new #BTC Bull Markets (first two orange circles)
During these Bull Runs, the 50 EMA tends to hold as support
However during Bear Markets, this 50 EMA is lost as support and turns into new resistance to confirm further downside
Once again, breakouts above the 50 EMA precede new #BTC Bull Markets (first two orange circles)
During these Bull Runs, the 50 EMA tends to hold as support
However during Bear Markets, this 50 EMA is lost as support and turns into new resistance to confirm further downside
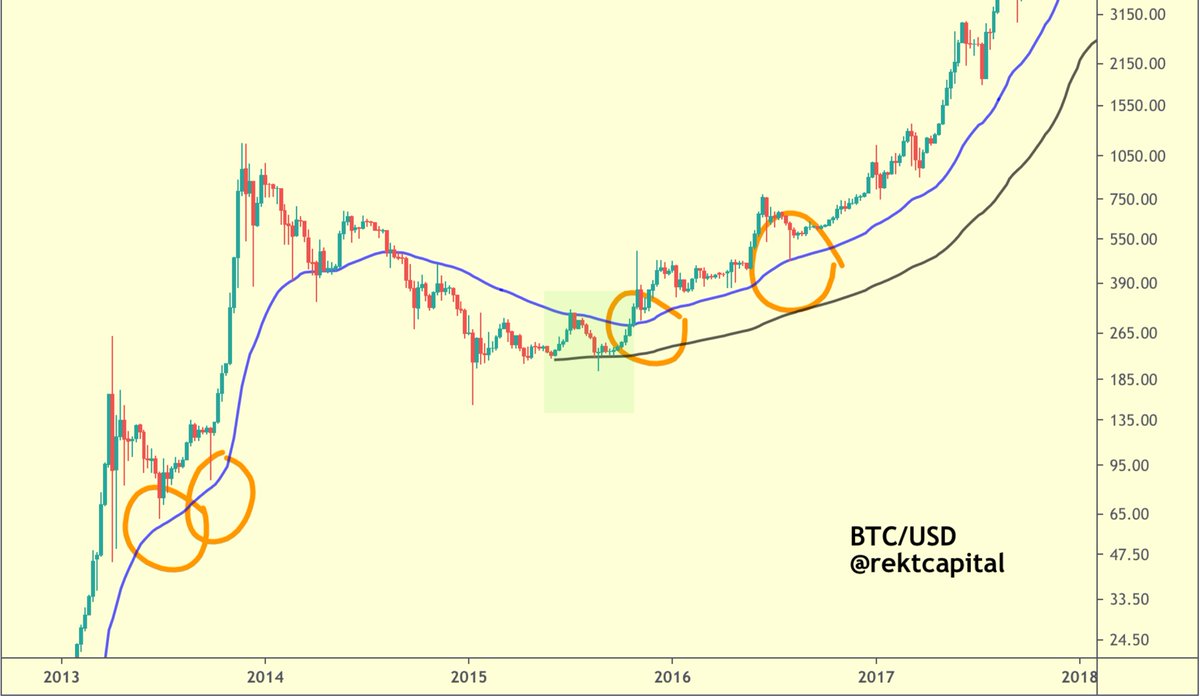
7.
The 200 EMA on the other hand highlights periods of maximum financial opportunity for #BTC
Whether $BTC forms support on the 200 EMA, forms an accumulation range below it or crashes below it...
The 200 EMA showcases periods of price that could offer investors outsized ROI
The 200 EMA on the other hand highlights periods of maximum financial opportunity for #BTC
Whether $BTC forms support on the 200 EMA, forms an accumulation range below it or crashes below it...
The 200 EMA showcases periods of price that could offer investors outsized ROI
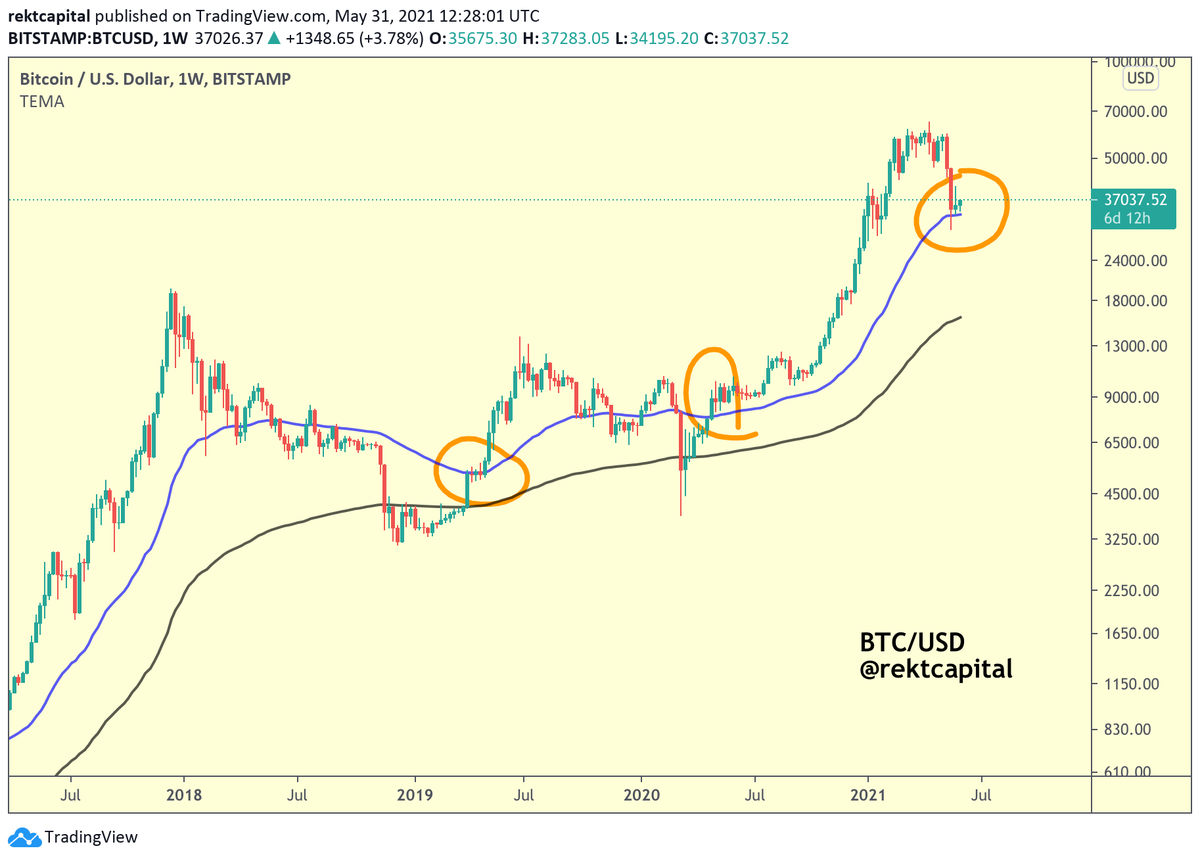
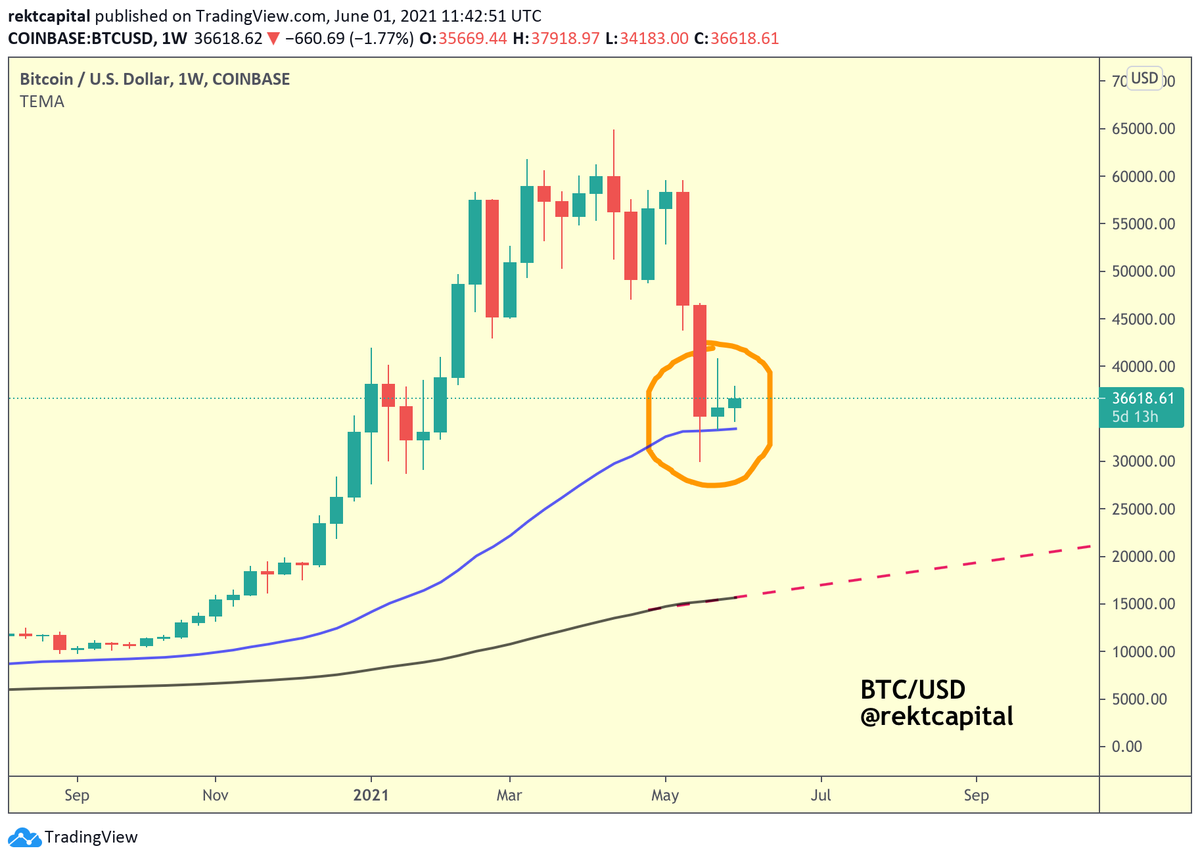
8.
Right now, #BTC is in the process of testing the 50 EMA as support
This upcoming rebound from this 50 EMA will be crucial
Here are two scenarios to watch out for:
Right now, #BTC is in the process of testing the 50 EMA as support
This upcoming rebound from this 50 EMA will be crucial
Here are two scenarios to watch out for:
9.
If the rebound from the 50 EMA is strong enough to rally above the $38K level and then the $45K level...
Then that would possibly count as a successful support test of the 50 EMA
In which case the EMA would preserve the bullish momentum and the Bull Market would continue
If the rebound from the 50 EMA is strong enough to rally above the $38K level and then the $45K level...
Then that would possibly count as a successful support test of the 50 EMA
In which case the EMA would preserve the bullish momentum and the Bull Market would continue
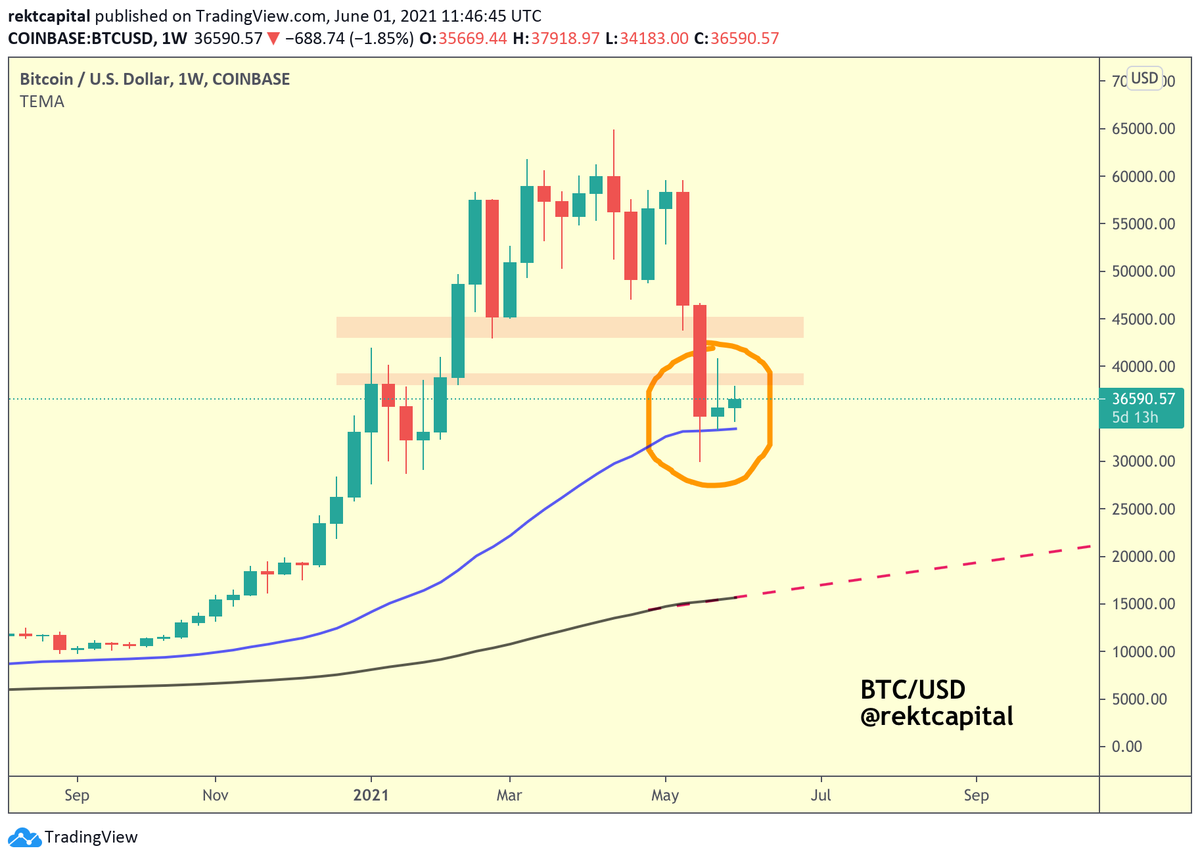
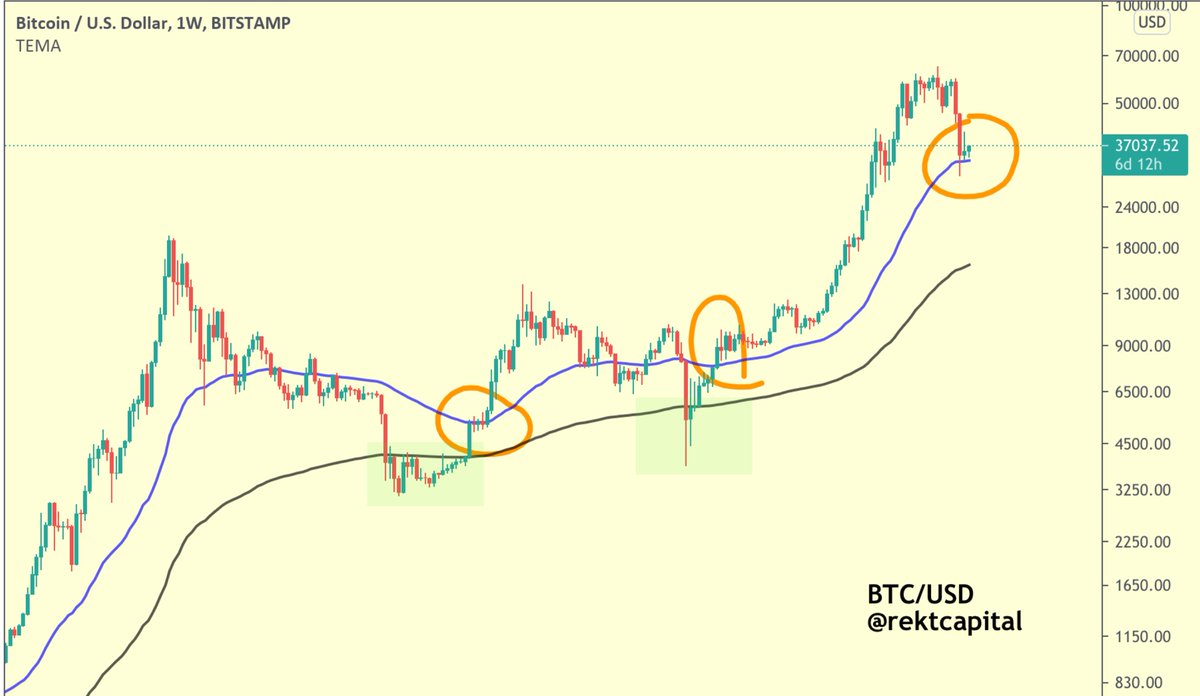
10.
However if the 50 EMA rebound is weak then that would count as a relief rally
In which case #BTC could lose the 50 EMA as support & be exposed to further downside
And while a crash to the 200 EMA (black) is unlikely, the closer $BTC gets to it - the better the opportunity
However if the 50 EMA rebound is weak then that would count as a relief rally
In which case #BTC could lose the 50 EMA as support & be exposed to further downside
And while a crash to the 200 EMA (black) is unlikely, the closer $BTC gets to it - the better the opportunity

11.
If you liked this thread, feel free to Subscribe to my YouTube channel where I share more analysis like this
youtube.com/rektcapital
#BTC #Crypto #Bitcoin
If you liked this thread, feel free to Subscribe to my YouTube channel where I share more analysis like this
youtube.com/rektcapital
#BTC #Crypto #Bitcoin
• • •
Missing some Tweet in this thread? You can try to
force a refresh