#BTC is on the cusp of a potential Death Cross
Whenever a Death Cross occurs, BTC experiences deeper downside
How likely is it that this Death Cross occurs for $BTC?
And if it does - what should we potentially expect?
Here's a thread with my thoughts about the Death Cross:
Whenever a Death Cross occurs, BTC experiences deeper downside
How likely is it that this Death Cross occurs for $BTC?
And if it does - what should we potentially expect?
Here's a thread with my thoughts about the Death Cross:
1.
A bullish Golden Cross occurs when the 50 EMA (blue) crosses OVER the 200 EMA (black)
Golden Crosses precede lots of upside in #BTC's price (green)
A bearish Death Cross occurs when the 50 EMA crosses UNDER the 200 EMA (red)
Death Crosses precede lots of downside for $BTC
A bullish Golden Cross occurs when the 50 EMA (blue) crosses OVER the 200 EMA (black)
Golden Crosses precede lots of upside in #BTC's price (green)
A bearish Death Cross occurs when the 50 EMA crosses UNDER the 200 EMA (red)
Death Crosses precede lots of downside for $BTC

2.
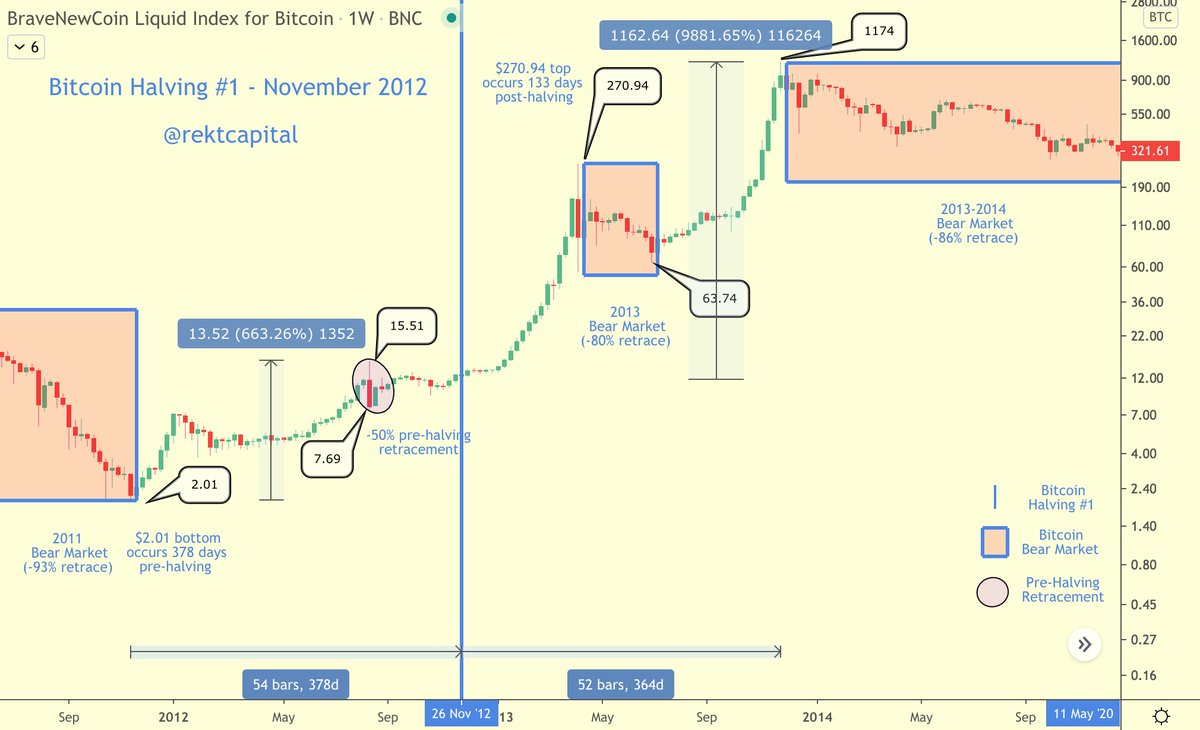
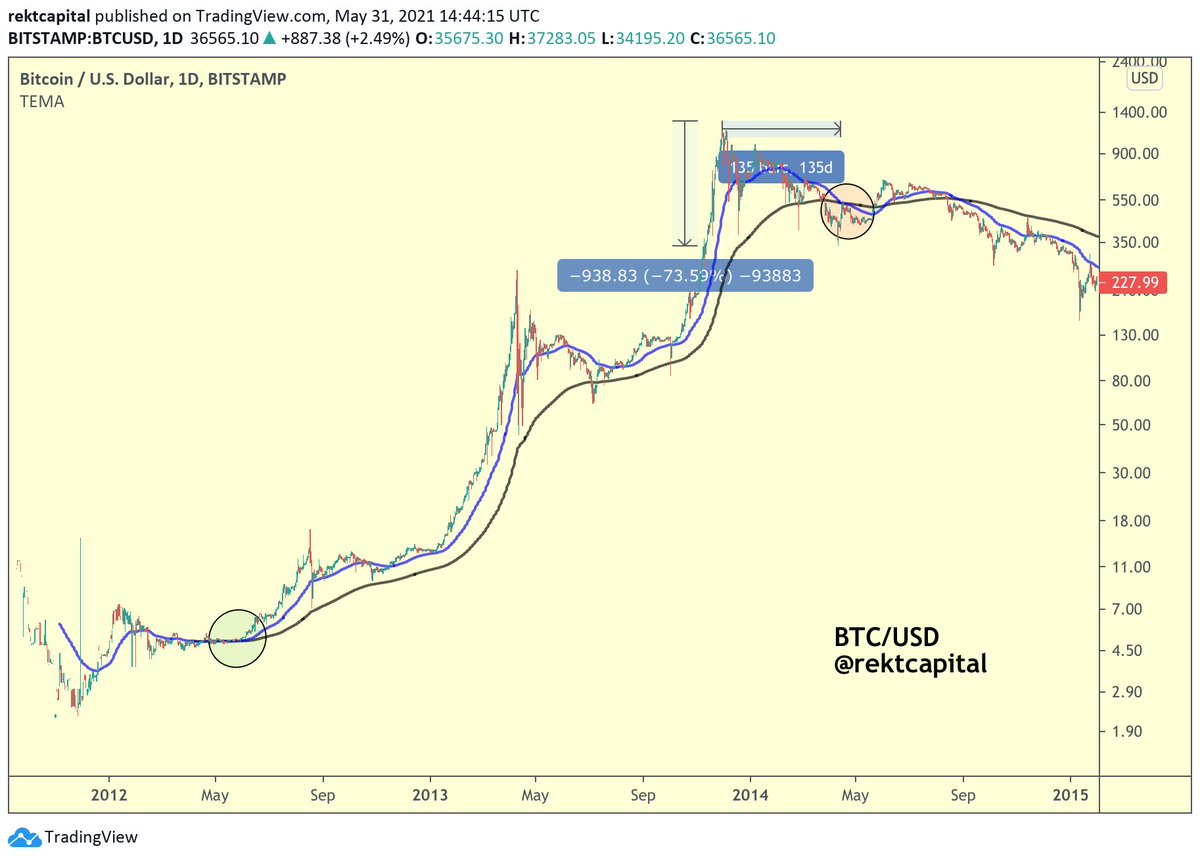
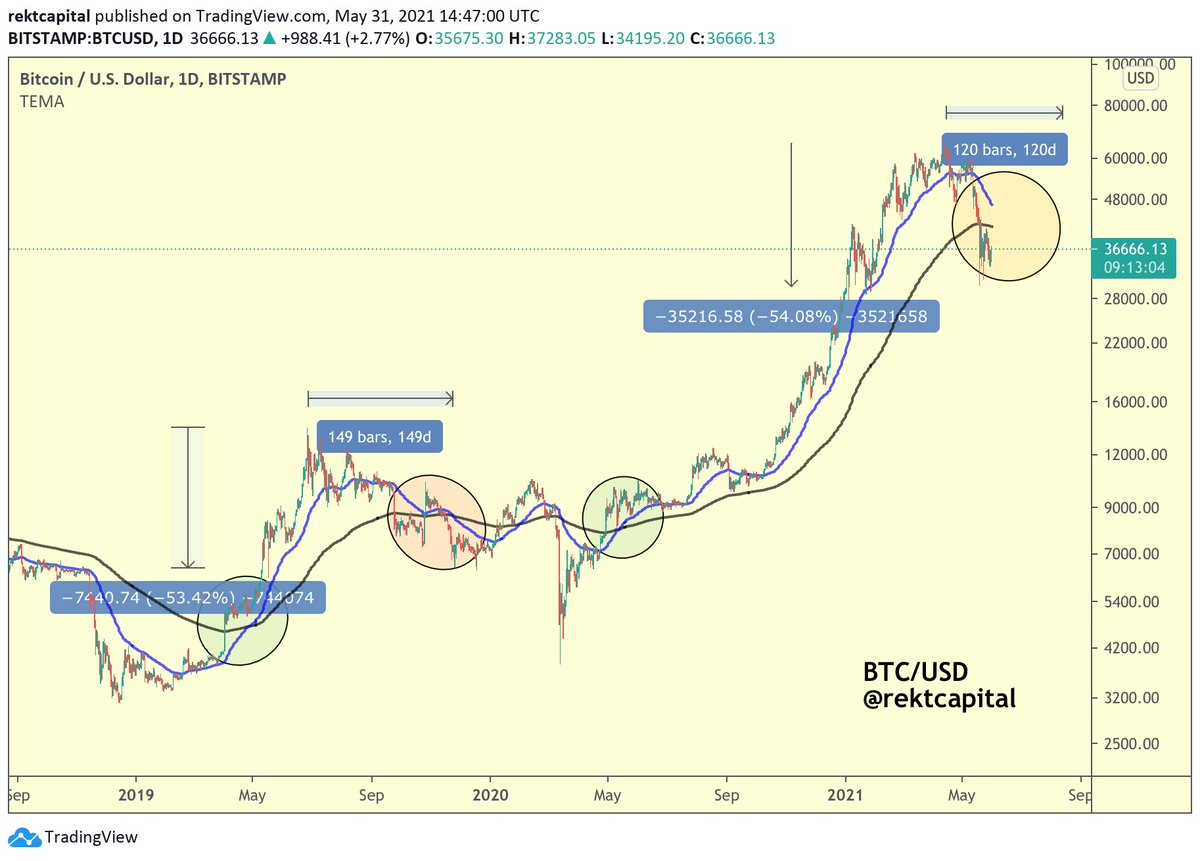
But notice how it takes a significant amount of time for #BTC to actually perform a bearish Death Cross (red)
When $BTC peaked in 2013, it took 135 days for the Death Cross to occur
That's over 4 months
And during those 4+ months...
#Bitcoin dropped -73%
But notice how it takes a significant amount of time for #BTC to actually perform a bearish Death Cross (red)
When $BTC peaked in 2013, it took 135 days for the Death Cross to occur
That's over 4 months
And during those 4+ months...
#Bitcoin dropped -73%

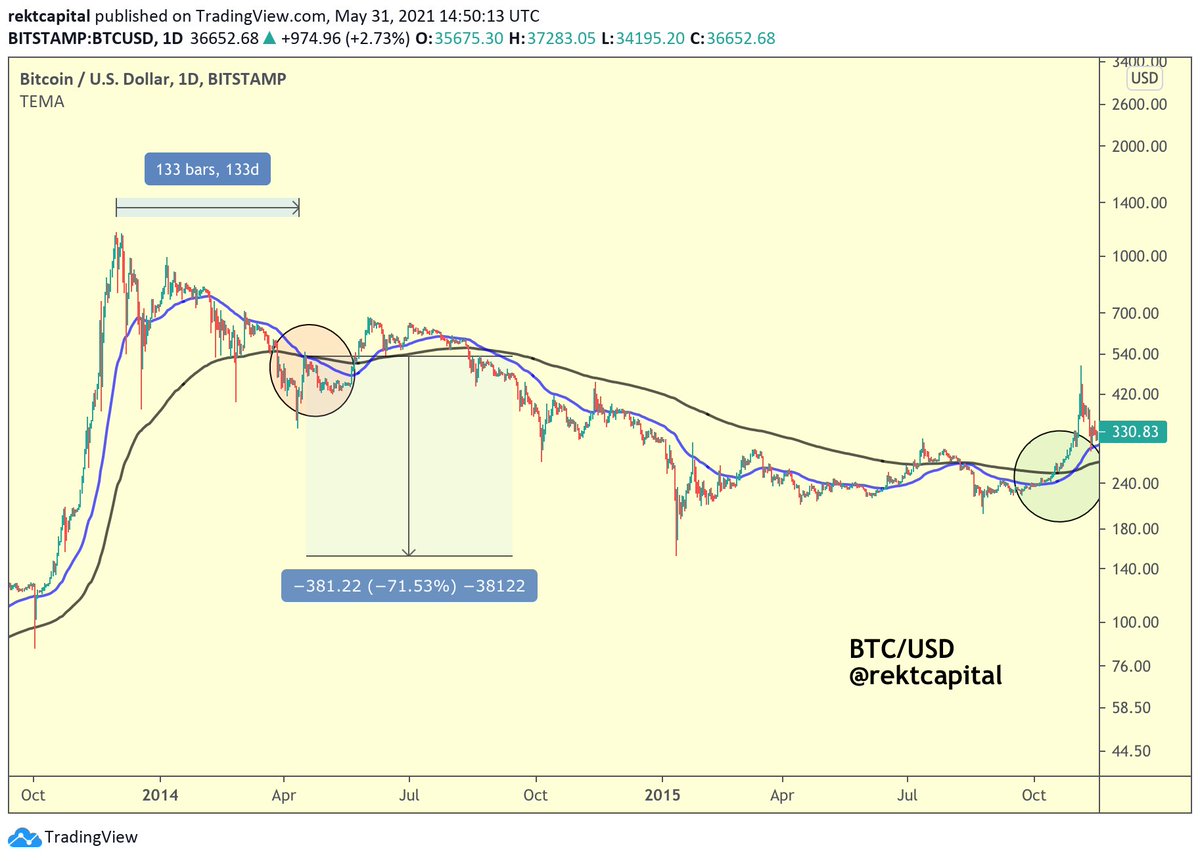
3.
The Death Cross occurs with some lag
So by the time it happens - a lot of downside will have already happened
That said, the Death Cross confirms a bearish trend and precedes even more downside
And in 2013, the Death Cross preceded an additional -71% drop...
The Death Cross occurs with some lag
So by the time it happens - a lot of downside will have already happened
That said, the Death Cross confirms a bearish trend and precedes even more downside
And in 2013, the Death Cross preceded an additional -71% drop...
4.
In sum, when #BTC peaked in 2013...
BTC dropped -73% in 135 days until the Death Cross happened
And when the Death Crossover actually occurred - $BTC dropped an additional -71% in the months that followed
In sum, when #BTC peaked in 2013...
BTC dropped -73% in 135 days until the Death Cross happened
And when the Death Crossover actually occurred - $BTC dropped an additional -71% in the months that followed

5.
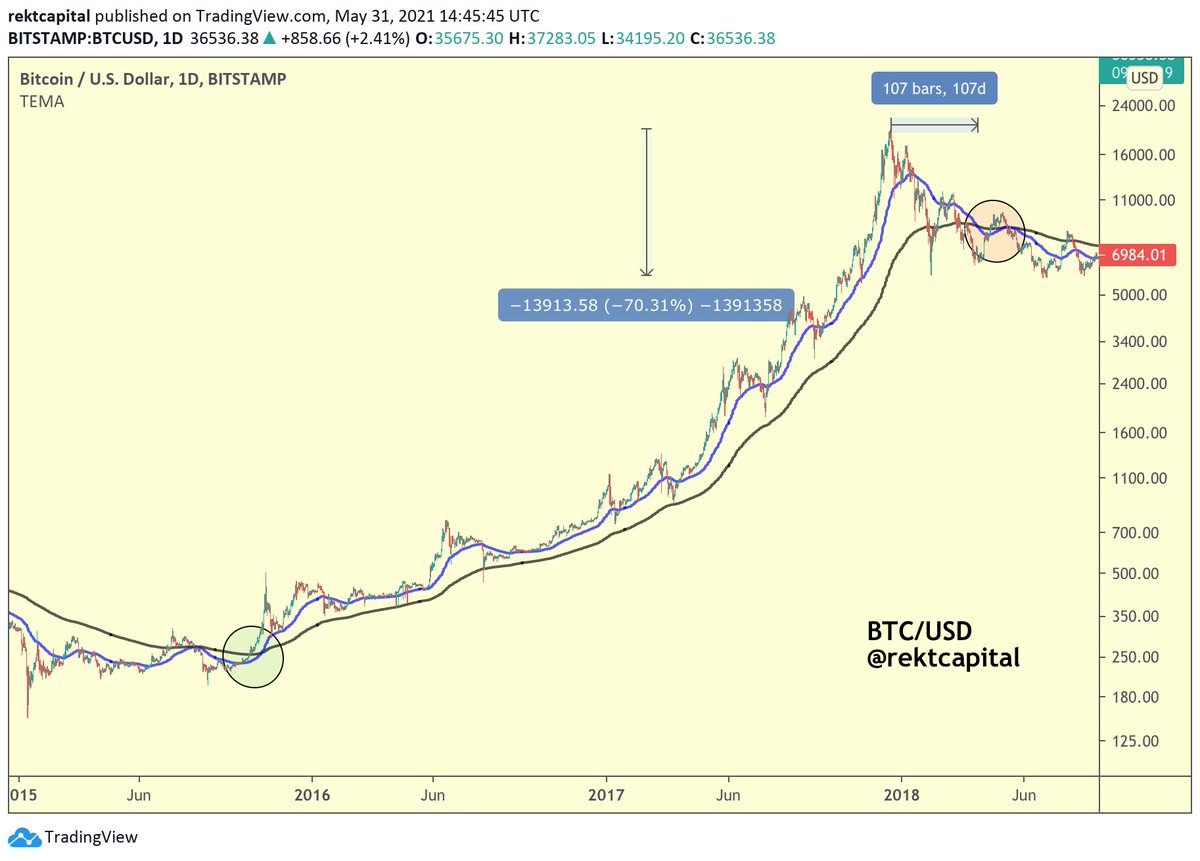
Let's take another period into account:
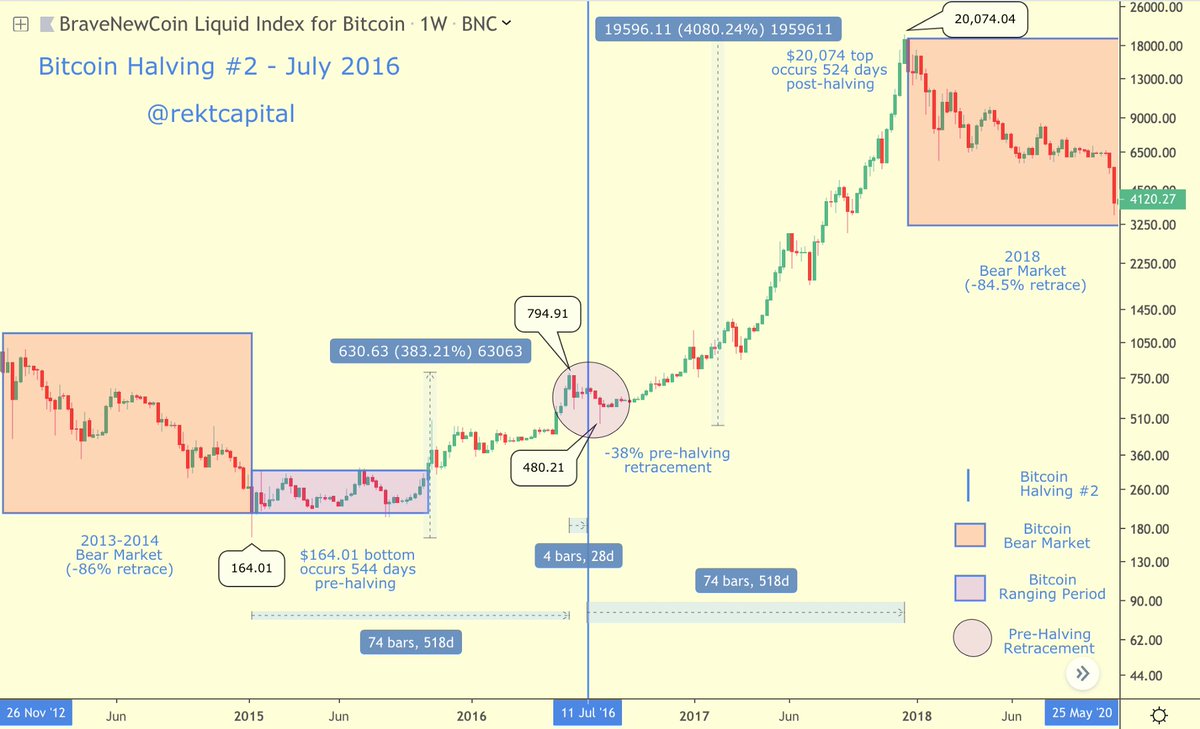
When $BTC peaked in 2017, it took 107 days for the Death Cross to occur
That's 3.5 months
And during those 3+ months...
#Bitcoin dropped -70% from the $20,000 peak
Let's take another period into account:
When $BTC peaked in 2017, it took 107 days for the Death Cross to occur
That's 3.5 months
And during those 3+ months...
#Bitcoin dropped -70% from the $20,000 peak

6.
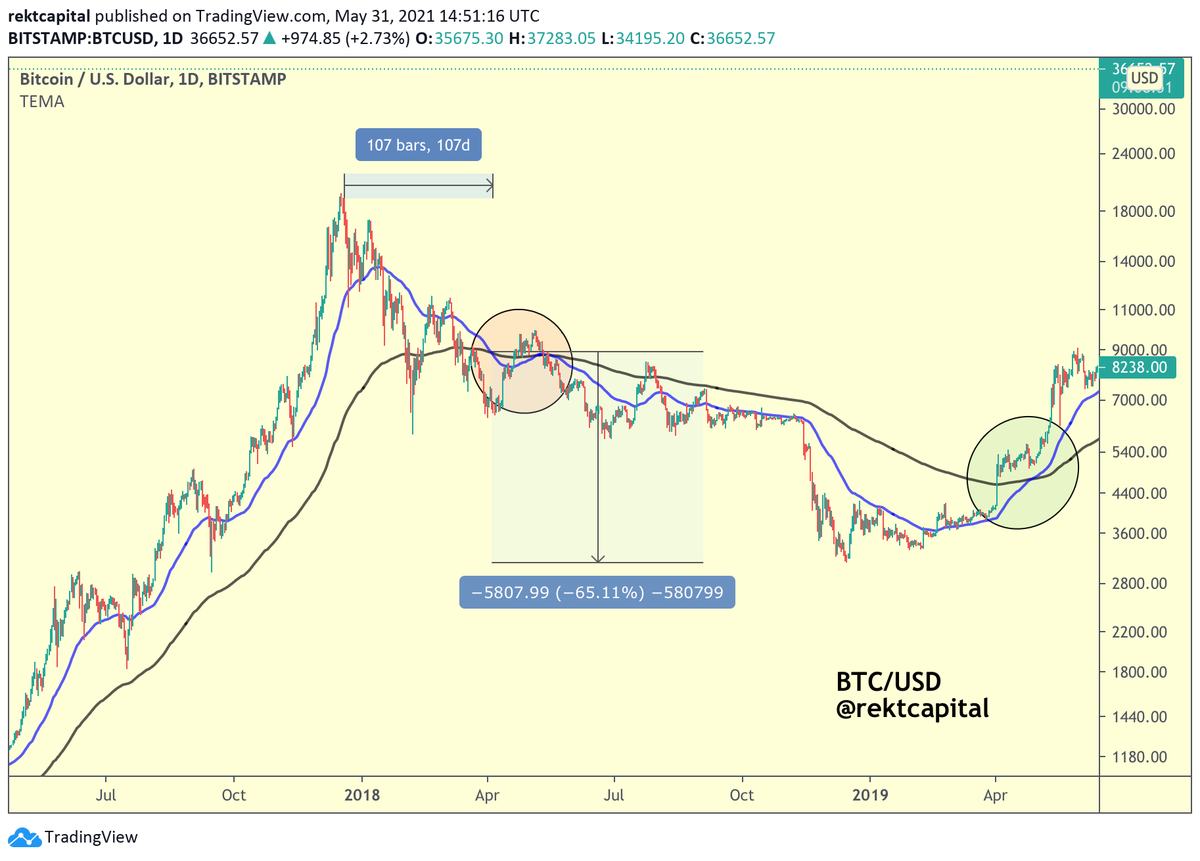
Yes, #BTC dropped -70% before the Death Cross actually occurred
But once the Death Cross happened, $BTC experienced an additional -65% correction to the downside
The Death Cross once again confirmed even more downside
Yes, #BTC dropped -70% before the Death Cross actually occurred
But once the Death Cross happened, $BTC experienced an additional -65% correction to the downside
The Death Cross once again confirmed even more downside

7.
In sum, when #BTC peaked in 2017...
BTC dropped -70% in 107 days until the Death Cross happened
And when the Death Crossover actually occurred - $BTC dropped an additional -65% in the months that followed
In sum, when #BTC peaked in 2017...
BTC dropped -70% in 107 days until the Death Cross happened
And when the Death Crossover actually occurred - $BTC dropped an additional -65% in the months that followed
8.
Let's now take a look at another historical Death Cross period:
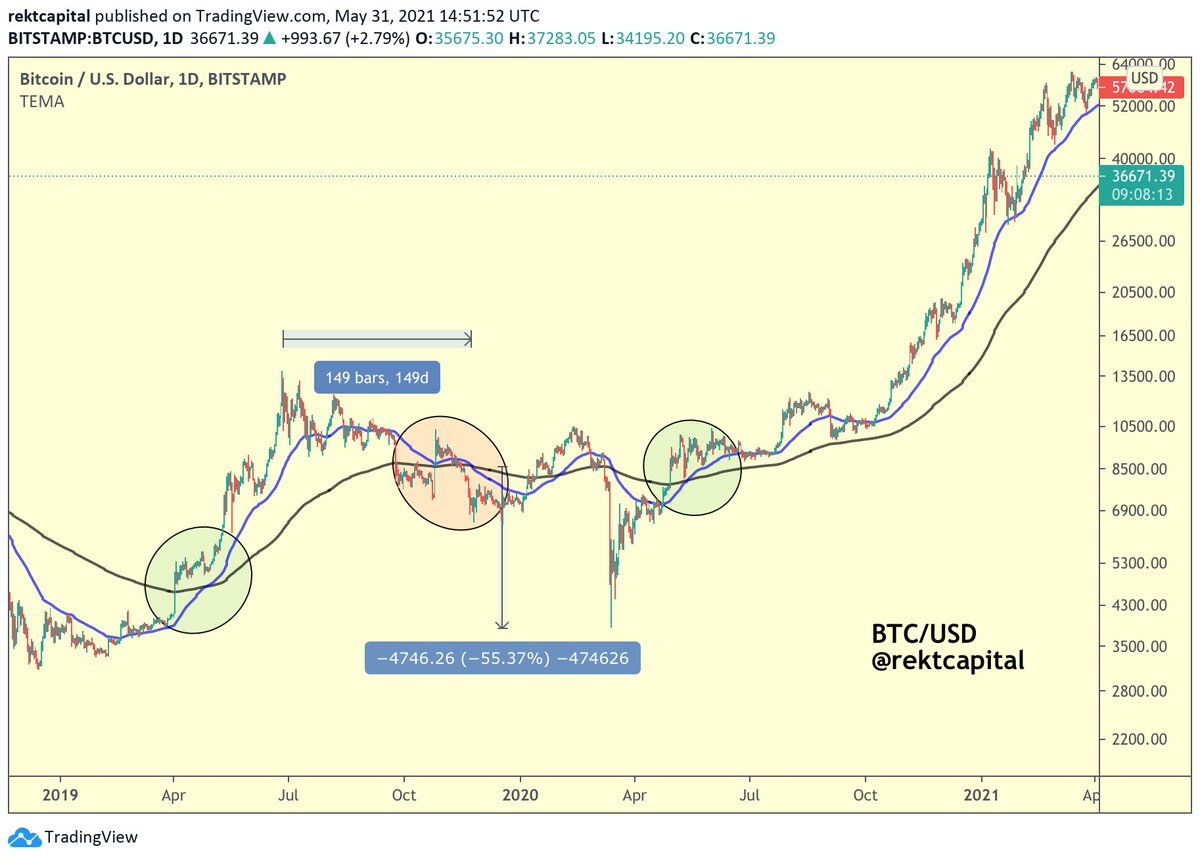
When $BTC peaked in June 2019, it took 149 days for the Death Cross to occur
It took BTC 5 months to perform a Death Cross
But until that Death Cross occurred, #BTC's price had already dropped by -53%
Let's now take a look at another historical Death Cross period:
When $BTC peaked in June 2019, it took 149 days for the Death Cross to occur
It took BTC 5 months to perform a Death Cross
But until that Death Cross occurred, #BTC's price had already dropped by -53%

9.
But once the Death Cross took place, #BTC dropped an additional -55% to the downside
In sum when $BTC peaked in June 2019, BTC first dropped -53% before the Death Cross took place
And once that Death Cross occurred, an additional -55% retrace happened for #Bitcoin
But once the Death Cross took place, #BTC dropped an additional -55% to the downside
In sum when $BTC peaked in June 2019, BTC first dropped -53% before the Death Cross took place
And once that Death Cross occurred, an additional -55% retrace happened for #Bitcoin
10.
#BTC is potentially on the cusp of a new Death Cross soon
Let's assume it happens (though it doesn't necessarily have to)
We need to now address two questions:
• When could this Death Cross happen?
• How much extra downside could $BTC see after it happens?
#BTC is potentially on the cusp of a new Death Cross soon
Let's assume it happens (though it doesn't necessarily have to)
We need to now address two questions:
• When could this Death Cross happen?
• How much extra downside could $BTC see after it happens?
11.
First let's address the question of "when"
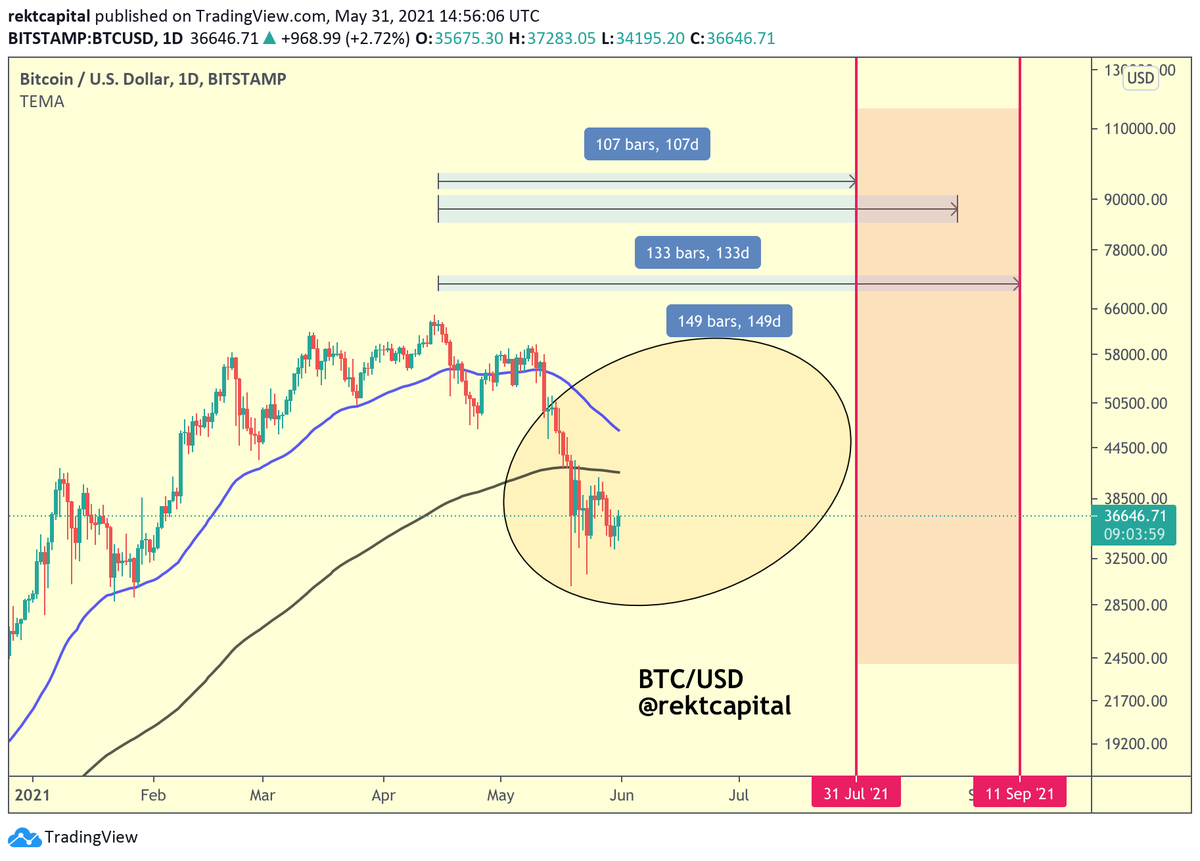
Historically, #BTC tends to perform a Death Cross between 107 to 149 days
If history repeats, $BTC could see its Death Cross occur sometime between very late July or in early September 2021 (red area)
First let's address the question of "when"
Historically, #BTC tends to perform a Death Cross between 107 to 149 days
If history repeats, $BTC could see its Death Cross occur sometime between very late July or in early September 2021 (red area)

12.
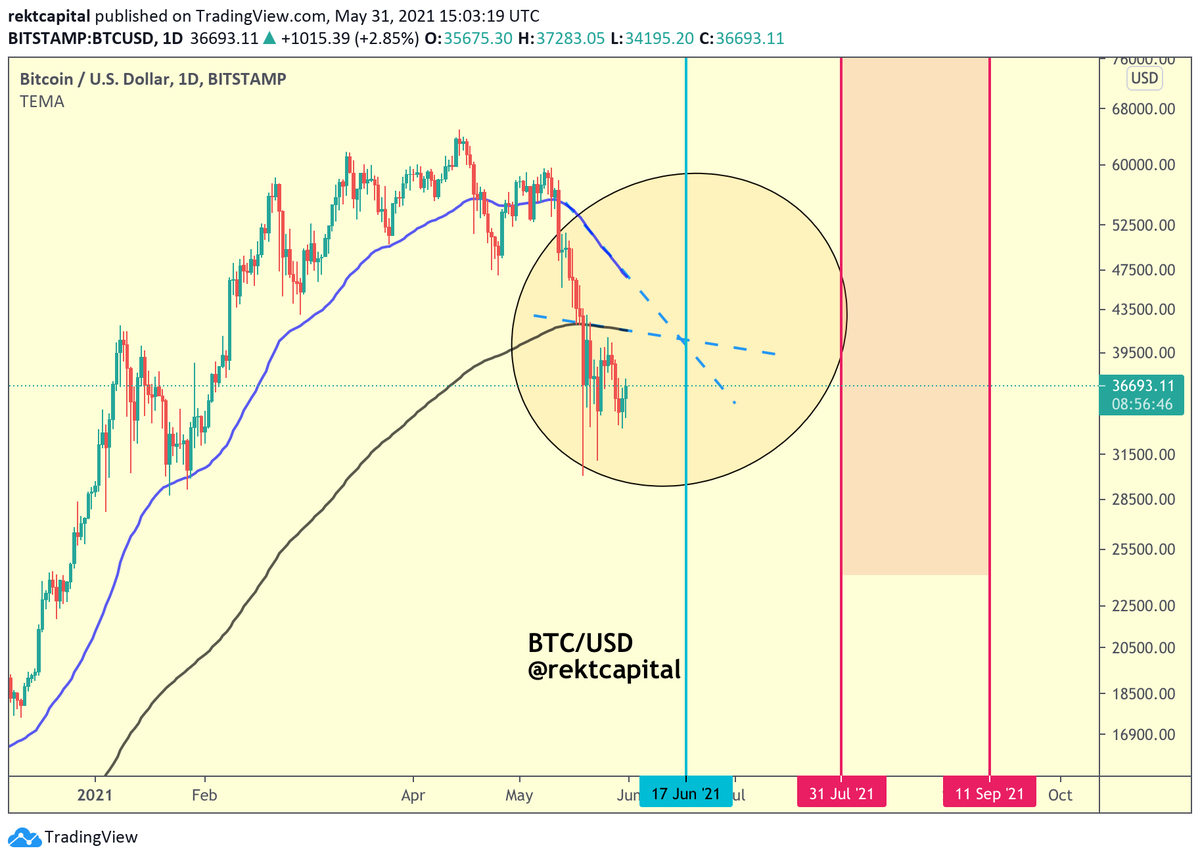
Right now, the 50 EMA (blue) and 200 EMA (black) are converging rapidly towards one another
If #BTC doesn't increase in its price soon and the EMAs continue at the same current pace...
The Death Cross could happen sooner in mid-June 2021 (blue)
Right now, the 50 EMA (blue) and 200 EMA (black) are converging rapidly towards one another
If #BTC doesn't increase in its price soon and the EMAs continue at the same current pace...
The Death Cross could happen sooner in mid-June 2021 (blue)
13.
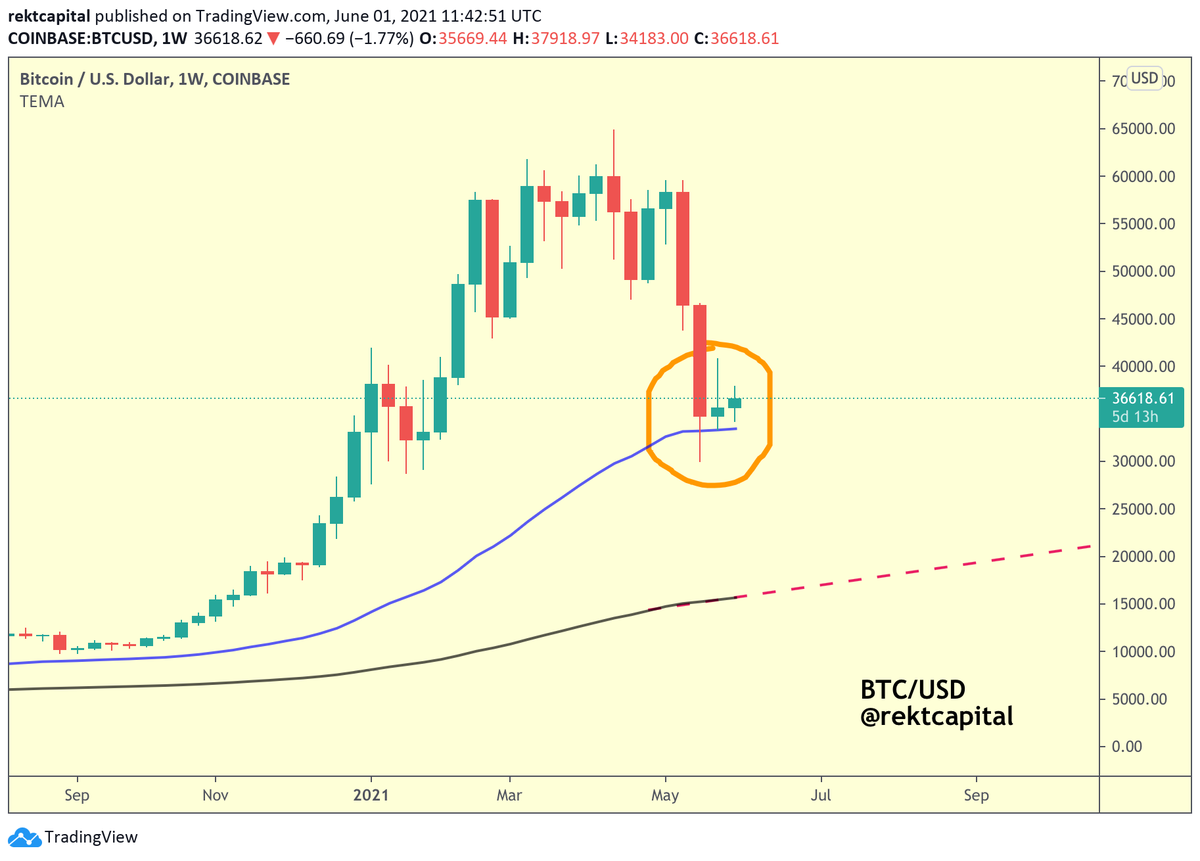
Now let's address the question of "how deep could #BTC retrace upon Death Cross"
So far, $BTC has crashed -54% since its ~$65K highs
And before we answer the question of how much downside could happen upon the Death Cross, let's recall the symmetry in past Death Crosses:
Now let's address the question of "how deep could #BTC retrace upon Death Cross"
So far, $BTC has crashed -54% since its ~$65K highs
And before we answer the question of how much downside could happen upon the Death Cross, let's recall the symmetry in past Death Crosses:
14.
The depth of a BTC correction pre-Death Cross is similar to retrace depth post-Death Cross
2013:
• #BTC drops -73% pre-Death Cross
• BTC drops extra -70% post-Death Cross
2017:
• -70% pre-Death Cross
• Extra -65% post-Death Cross
2019:
• -53% pre-DC
• -55% post-DC
The depth of a BTC correction pre-Death Cross is similar to retrace depth post-Death Cross
2013:
• #BTC drops -73% pre-Death Cross
• BTC drops extra -70% post-Death Cross
2017:
• -70% pre-Death Cross
• Extra -65% post-Death Cross
2019:
• -53% pre-DC
• -55% post-DC
15.
So since #BTC has crashed -54% already and should this symmetry hold, BTC could crash an extra -54% if a Death Cross happened today
This would result in a ~$18,000 $BTC
So since #BTC has crashed -54% already and should this symmetry hold, BTC could crash an extra -54% if a Death Cross happened today
This would result in a ~$18,000 $BTC
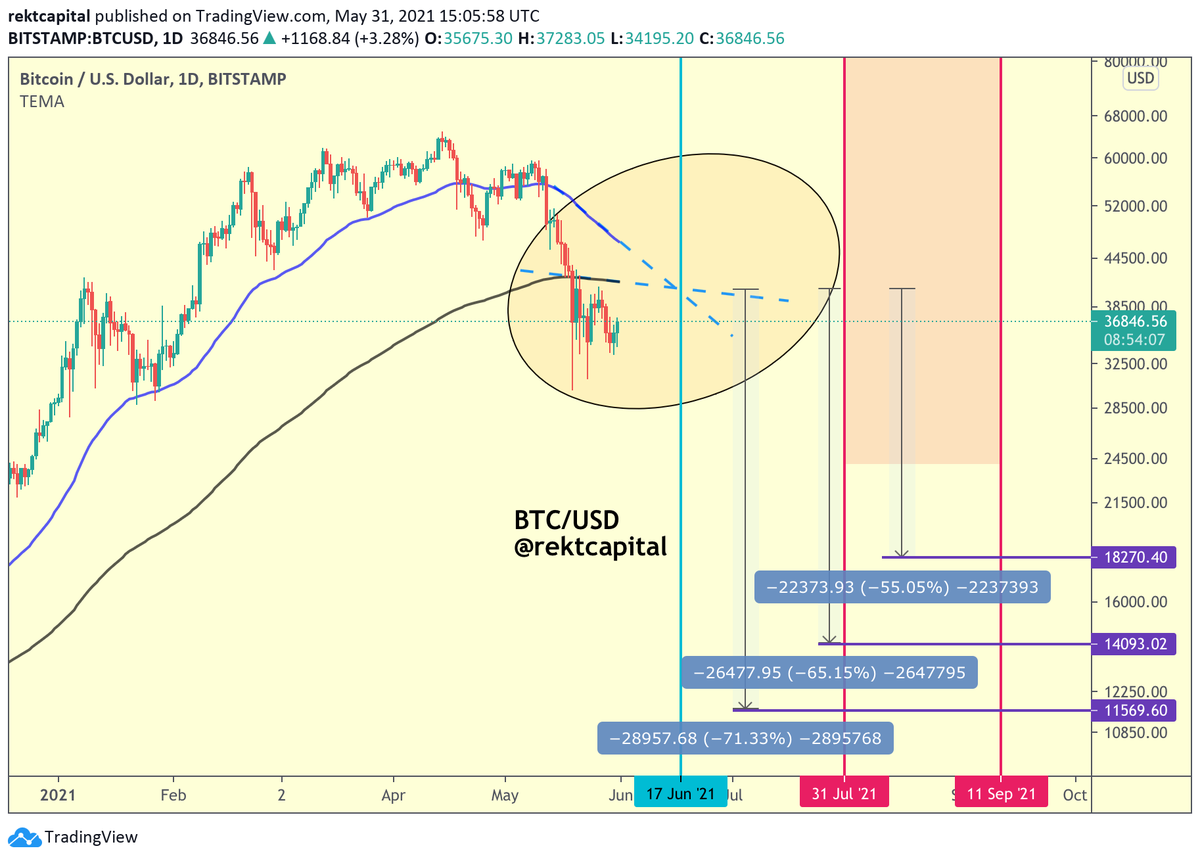
16.
This sort of symmetry would be in line with history as #BTC crashed an extra -55% post-Death Cross after the June 2019 peak
But if history were to repeat itself with a -65% or -71% crash...
That would result in a $14000 and $11500 $BTC which both seem very unlikely
This sort of symmetry would be in line with history as #BTC crashed an extra -55% post-Death Cross after the June 2019 peak
But if history were to repeat itself with a -65% or -71% crash...
That would result in a $14000 and $11500 $BTC which both seem very unlikely

17.
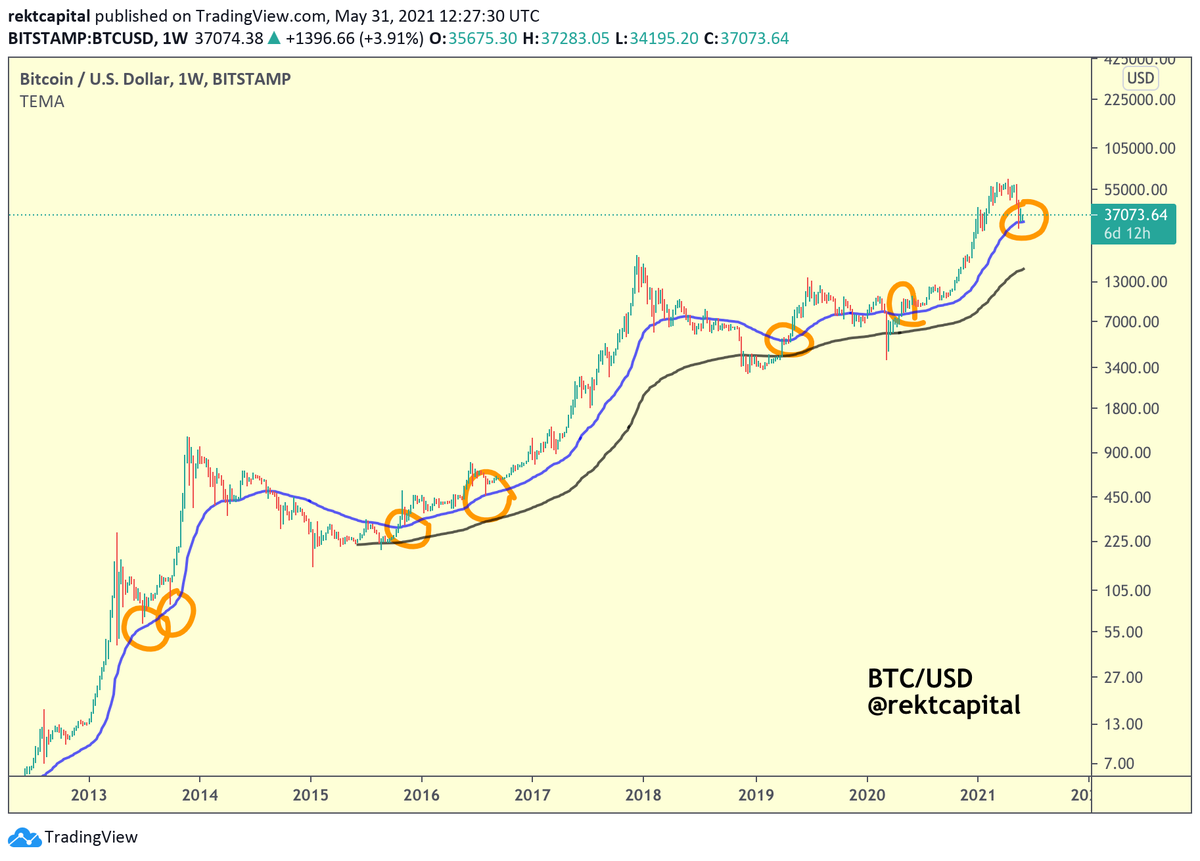
What's interesting about the scenario of a -55% post-Death Cross crash however is that it would result in a $18000 BTC
Which ties in with the 200-Week EMA (black) which tends to offer fantastic opportunities with outsized ROI for #BTC investors (green boxes highlight this)
What's interesting about the scenario of a -55% post-Death Cross crash however is that it would result in a $18000 BTC
Which ties in with the 200-Week EMA (black) which tends to offer fantastic opportunities with outsized ROI for #BTC investors (green boxes highlight this)
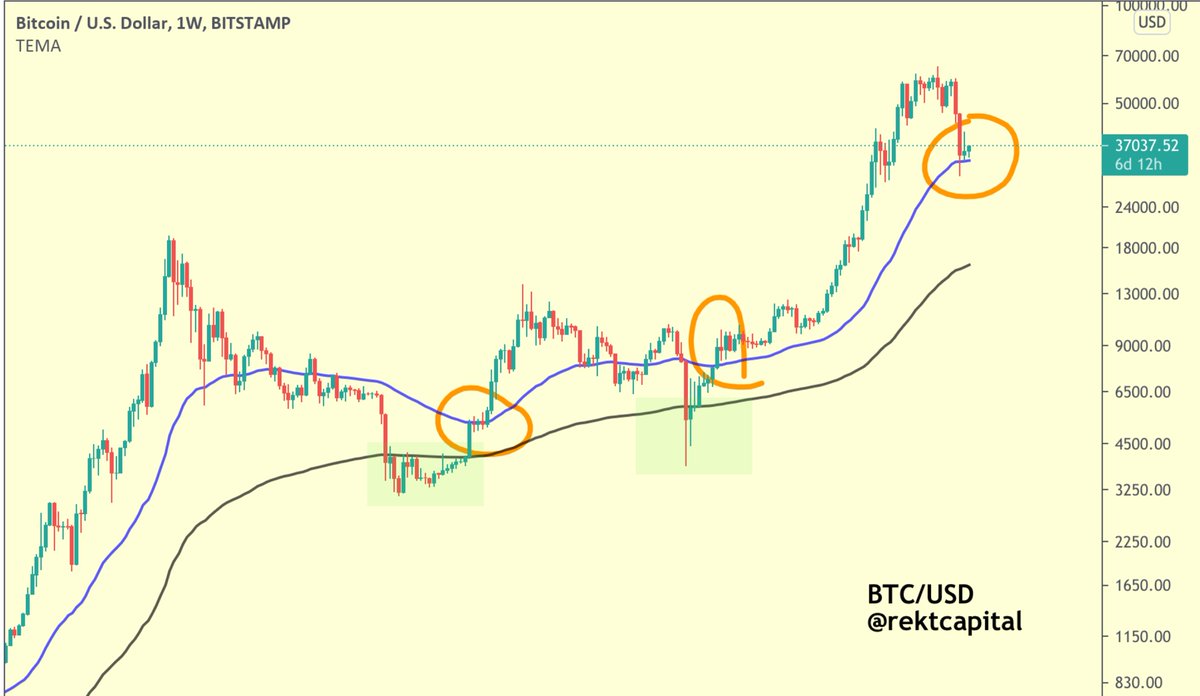
18.
If the Death Cross happens today, then a -55% crash towards the 200-Week EMA would tie in with my analysis in a previous thread:
But this possibility would ONLY be possible if the 50-Week EMA is lost as support and a Death Cross occurs soon
If the Death Cross happens today, then a -55% crash towards the 200-Week EMA would tie in with my analysis in a previous thread:
https://twitter.com/rektcapital/status/1399696440927133698?s=20
But this possibility would ONLY be possible if the 50-Week EMA is lost as support and a Death Cross occurs soon
19.
This type of extensive analysis is something I only share in the Rekt Capital Newsletter
So if you liked this thread - you'll love the newsletter
Feel free to sign up for regular cutting-edge insights on #BTC and Altcoins:
rektcapital.substack.com
#Crypto #Bitcoin
This type of extensive analysis is something I only share in the Rekt Capital Newsletter
So if you liked this thread - you'll love the newsletter
Feel free to sign up for regular cutting-edge insights on #BTC and Altcoins:
rektcapital.substack.com
#Crypto #Bitcoin
• • •
Missing some Tweet in this thread? You can try to
force a refresh