Thx again @Dr_Keefer for invite to discuss energy equity on @DecouplePodcast
Equity is one of the main reasons I decided to research electricity
We discussed global & USA electricity access, usage, poverty & distribution, so this "side" thread unpacks some of these trends
🧵
Equity is one of the main reasons I decided to research electricity
We discussed global & USA electricity access, usage, poverty & distribution, so this "side" thread unpacks some of these trends
🧵
https://twitter.com/Dr_Keefer/status/1401450366416437249
2/n. UN SDG Goal 7.1 is to have universal access to electricity by 2030
F1 shows access in urban areas has increased from 94% to 97% overall
USA, Canada & OECD achieved this generations ago; India and Middle Income countries more recently and now LDCs still have 20% gap
F1 shows access in urban areas has increased from 94% to 97% overall
USA, Canada & OECD achieved this generations ago; India and Middle Income countries more recently and now LDCs still have 20% gap

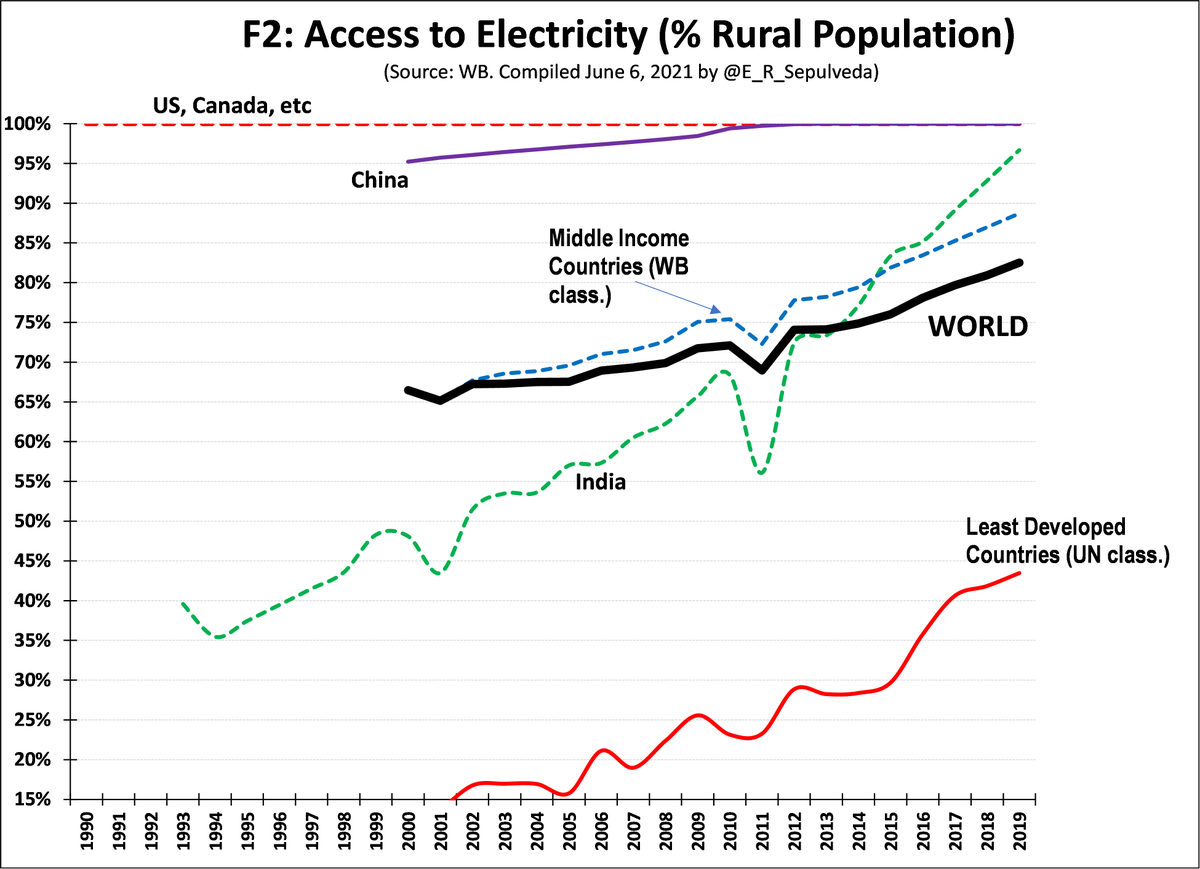
3/n. Lower population density & incomes have always made rural electrification a challenge...
F2 shows rural access lags urban, with global access increased from 65% to 83%
China & India have made great strides, but challenge remains in LDCs where less than half have access
F2 shows rural access lags urban, with global access increased from 65% to 83%
China & India have made great strides, but challenge remains in LDCs where less than half have access
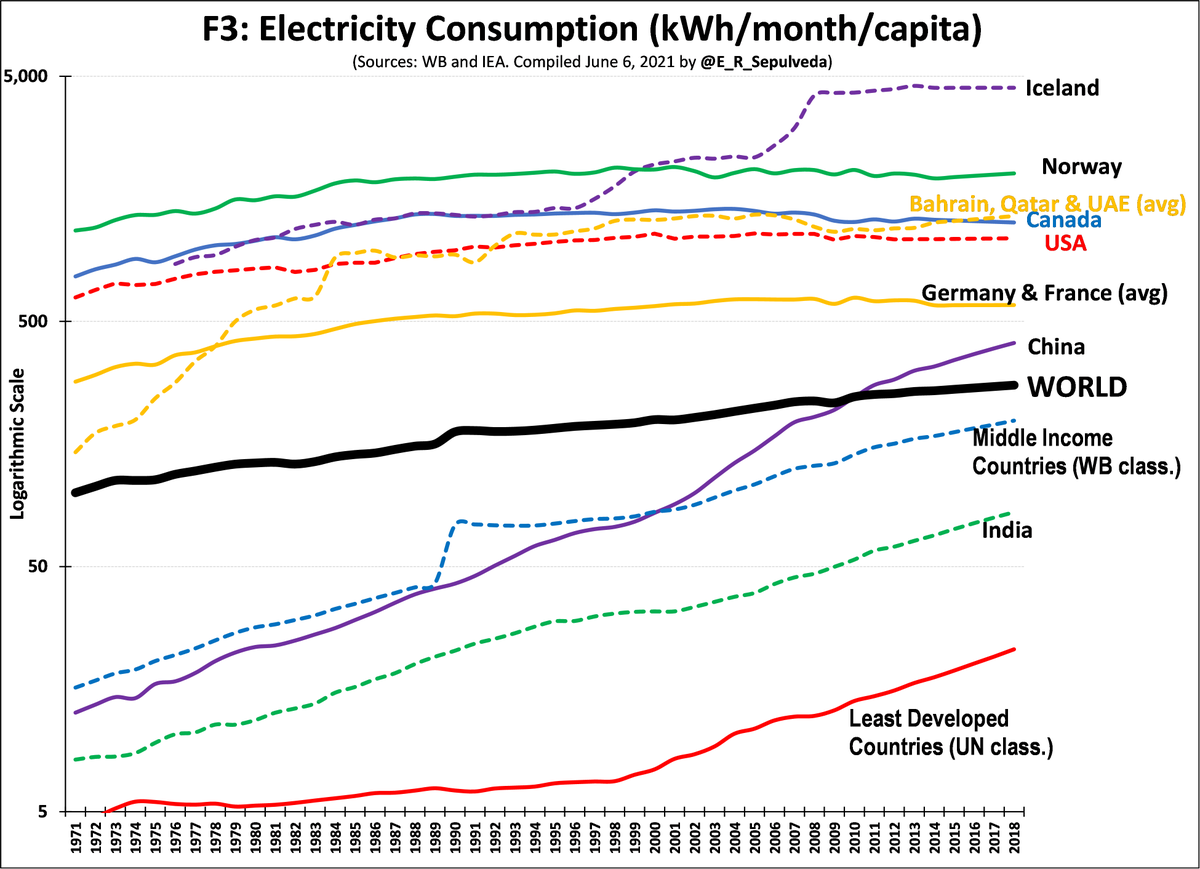
4/n. Access is evenly distributed compared to usage, which is more related to income & industry
F3 (log form) shows global growth in "load"
Global average=275 kWh/month/person; LDCs=25, while USA, Canada, France, Germany, etc. in 500-1,300 range. Highlight China's growth to 400
F3 (log form) shows global growth in "load"
Global average=275 kWh/month/person; LDCs=25, while USA, Canada, France, Germany, etc. in 500-1,300 range. Highlight China's growth to 400
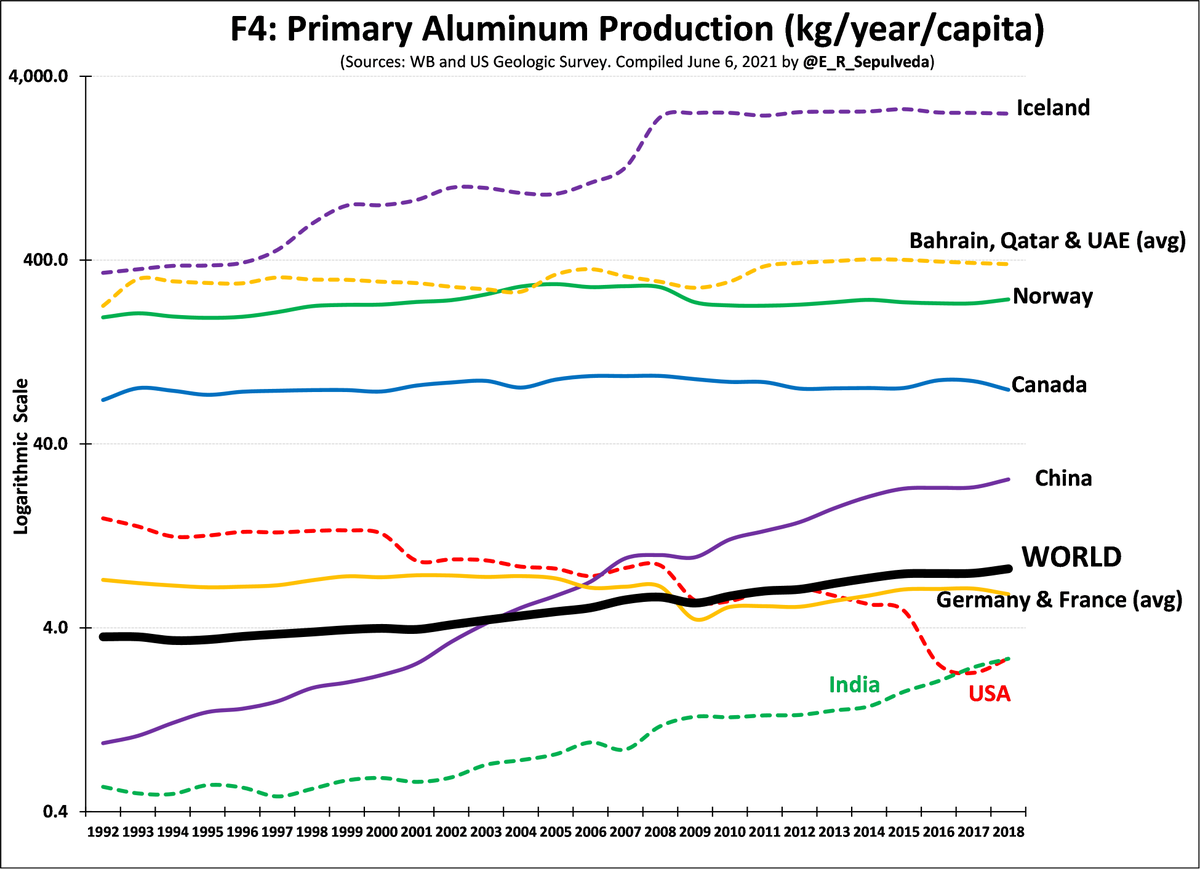
5/n. Very high kWh usage in Iceland, NO, Bahrain, Qatar & UAE (5AL) = high incomes & kWh-intensive industry. F5 shows AL global production = 8kg/year/person, with the 5AL as leaders
See Iceland F3 & F4 uptick in 2008? Alcoa of USA set up 3rd smelter in there... USA had 30, now 5
See Iceland F3 & F4 uptick in 2008? Alcoa of USA set up 3rd smelter in there... USA had 30, now 5
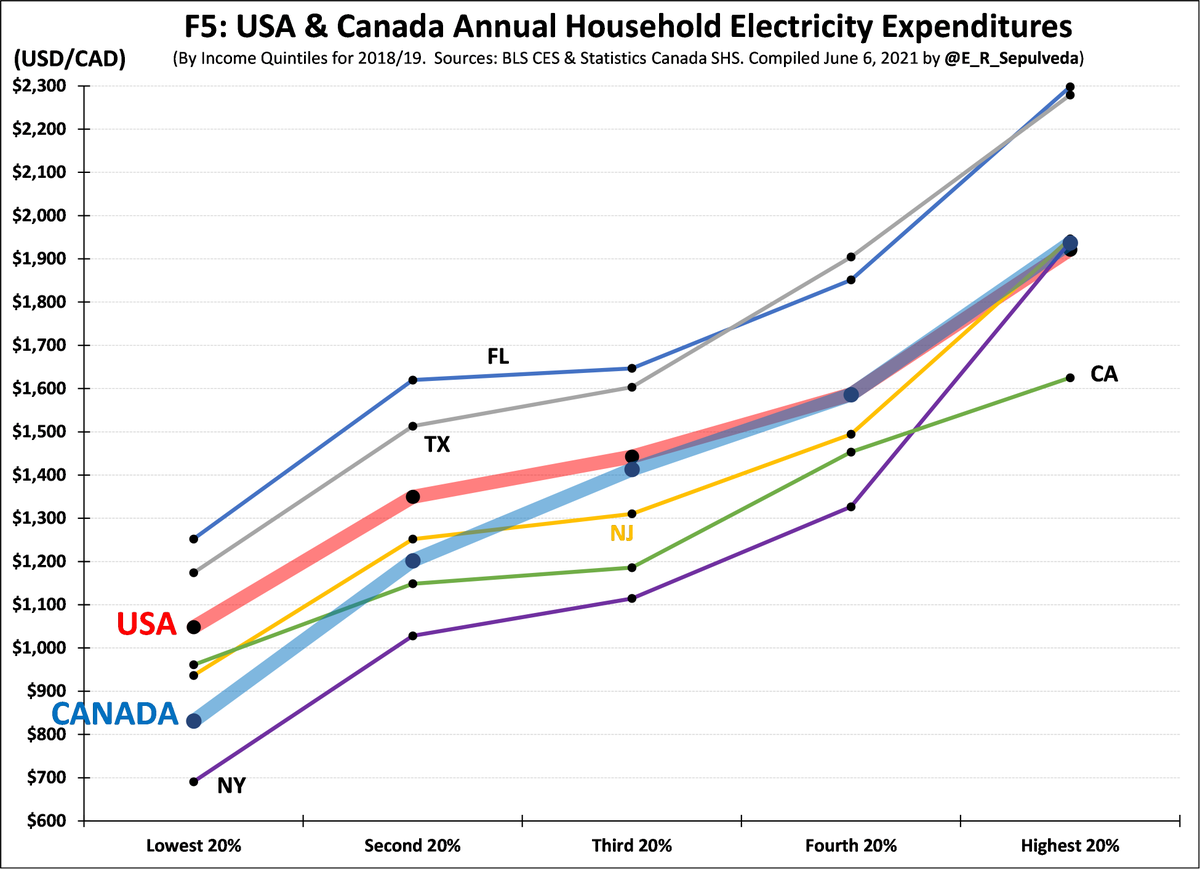
6/n. Now national-level kWh usage & poverty; USA focus, based on previous Canada (CAD) work
F5 shows avg. household (HH) USA& CAD electricity spending by 5 HH income groups (quintiles (Q), and five USA states
Notes: higher FL & TX driven by AC use; CA 5thQ outlier - due to NEM?
F5 shows avg. household (HH) USA& CAD electricity spending by 5 HH income groups (quintiles (Q), and five USA states
Notes: higher FL & TX driven by AC use; CA 5thQ outlier - due to NEM?
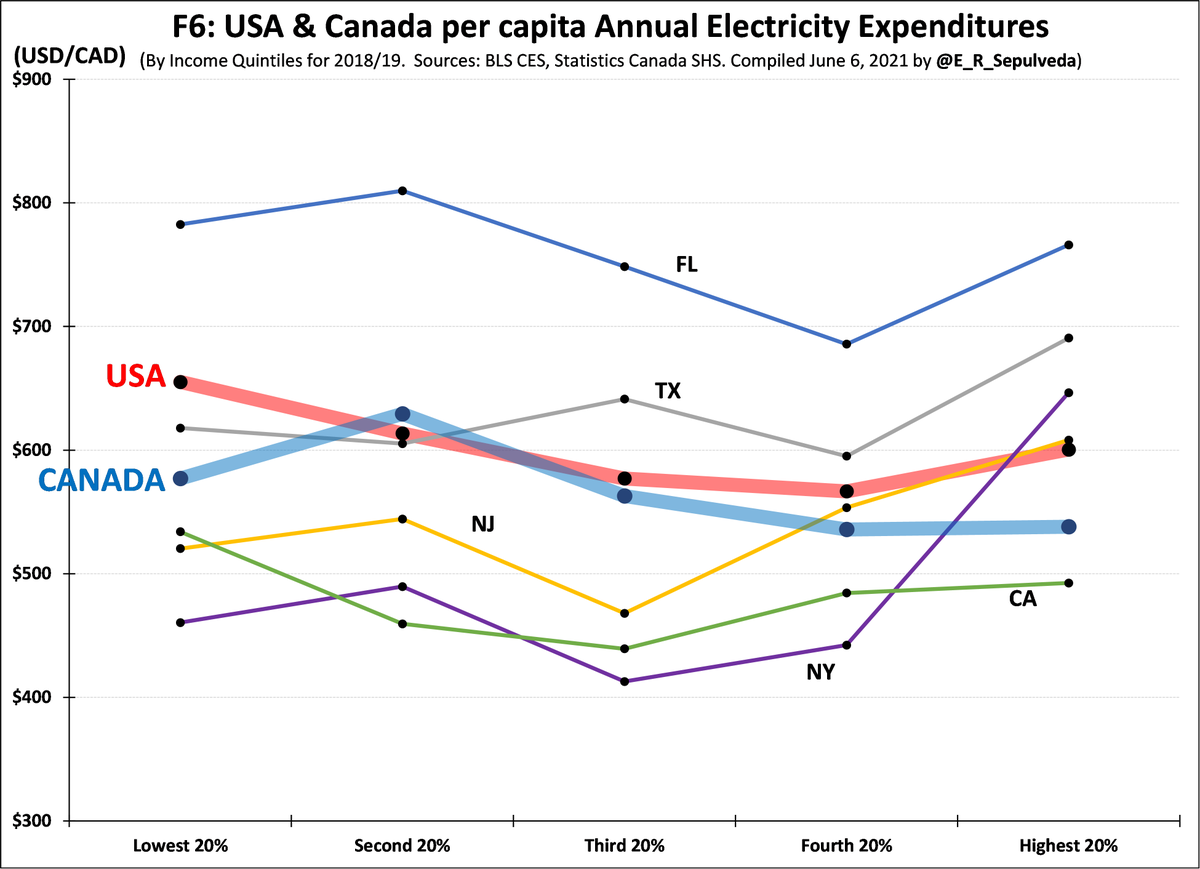
7/n. But HH Q deceptive on person basis because of HH sizes (1.5 in 1Q; 3.0-3.5 in 5Q).
F6 adjusts for HH size and shows that on a person basis spending is relatively similar across HH incomes
This is evidence that electricity is a "necessity" good with inelastic demand....
F6 adjusts for HH size and shows that on a person basis spending is relatively similar across HH incomes
This is evidence that electricity is a "necessity" good with inelastic demand....
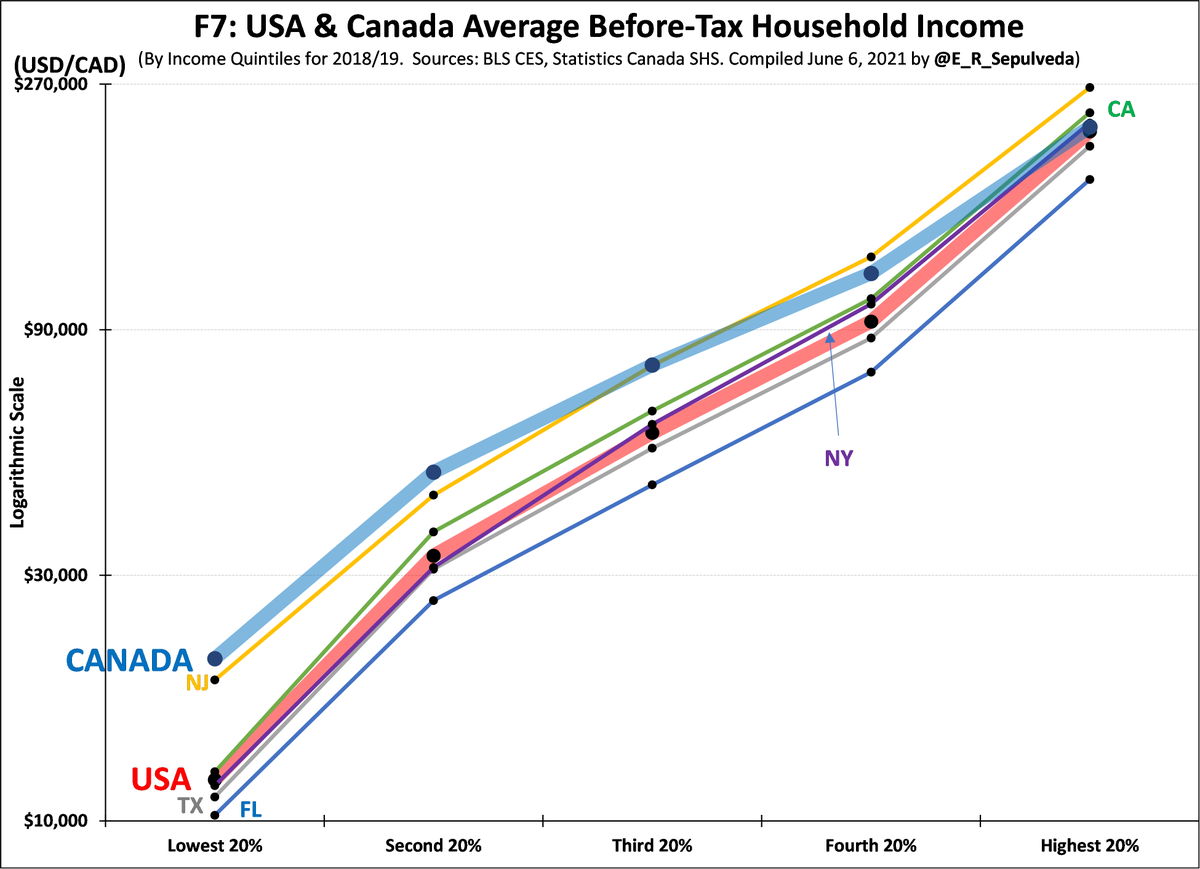
8/n. But, if electricity usage is relatively evenly distributed, we know that income is not..
F7 shows the average before tax income for five HH groups for USA, five states & CAD (context)
Given spend & rel. lower 1Q incomes, expect higher electricity burden/poverty in FL & TX
F7 shows the average before tax income for five HH groups for USA, five states & CAD (context)
Given spend & rel. lower 1Q incomes, expect higher electricity burden/poverty in FL & TX
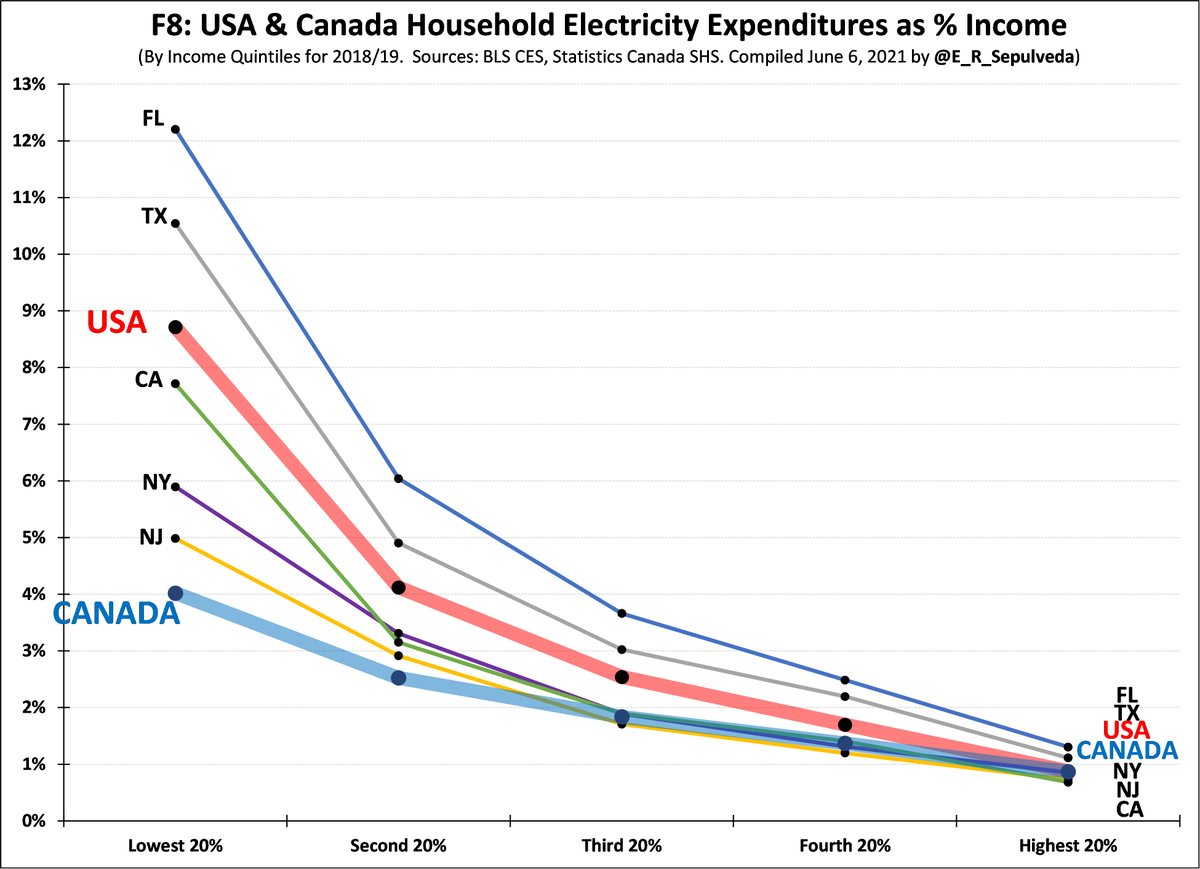
9/9. Indeed, F8 shows 1Q HH in FL & TX spend 11-12% income on electricity! CA, NY and NJ 1Q lower; 5Q HHs spend 1%
Within sector, lower overall prices, reformed tariff regimes & targeted 1Q programs improve equity & reduce poverty. More broadly, so would higher 1Q incomes!
END
Within sector, lower overall prices, reformed tariff regimes & targeted 1Q programs improve equity & reduce poverty. More broadly, so would higher 1Q incomes!
END
@threadreaderapp unroll
• • •
Missing some Tweet in this thread? You can try to
force a refresh


