-- When Macro Top? When Exit/Sell? --
This thread will cover a few indicators and metrics i will be looking at to help me identify when i should start to sell my #Bitcoin with the potential of a bear market to come.
TLDR: When i am going to sell my #Crypto
🔹Q2/3 2022 @ ~$200k
This thread will cover a few indicators and metrics i will be looking at to help me identify when i should start to sell my #Bitcoin with the potential of a bear market to come.
TLDR: When i am going to sell my #Crypto
🔹Q2/3 2022 @ ~$200k

-- 1/ The #Bitcoin / #Crypto Bubble --
First thing is understand how bubble markets move, & especially how the #cryptocurrency market moved in the past, & where we are now.
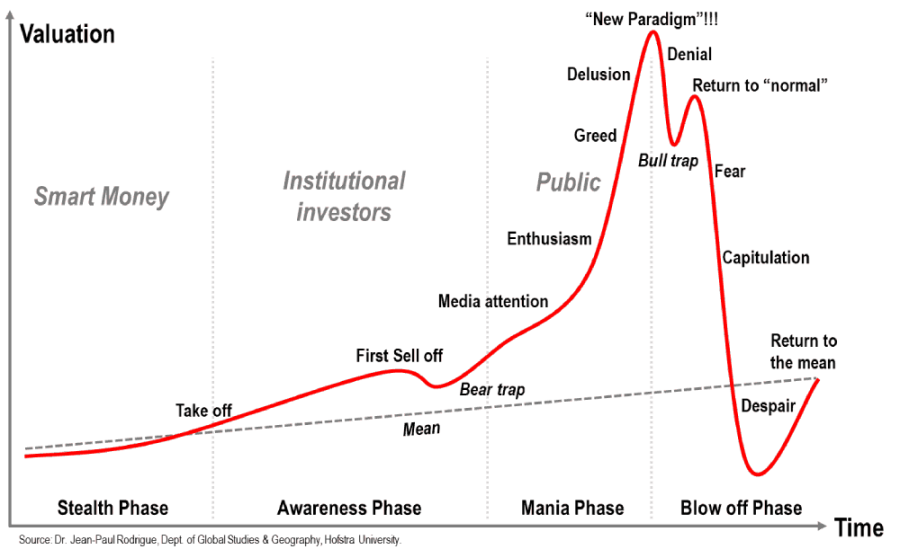
Below shows the stages of a bubble market, which #BTC has been through 3 full cycles & now is in its 4th.
First thing is understand how bubble markets move, & especially how the #cryptocurrency market moved in the past, & where we are now.
Below shows the stages of a bubble market, which #BTC has been through 3 full cycles & now is in its 4th.

-- 2/ Retail FOMO --
There are 2 key metrics that I use to help understand the stage of the bubble which we are in & when a top is close.
1⃣ Google Trends
2⃣ Fear & Greed Index
There are 2 key metrics that I use to help understand the stage of the bubble which we are in & when a top is close.
1⃣ Google Trends
2⃣ Fear & Greed Index

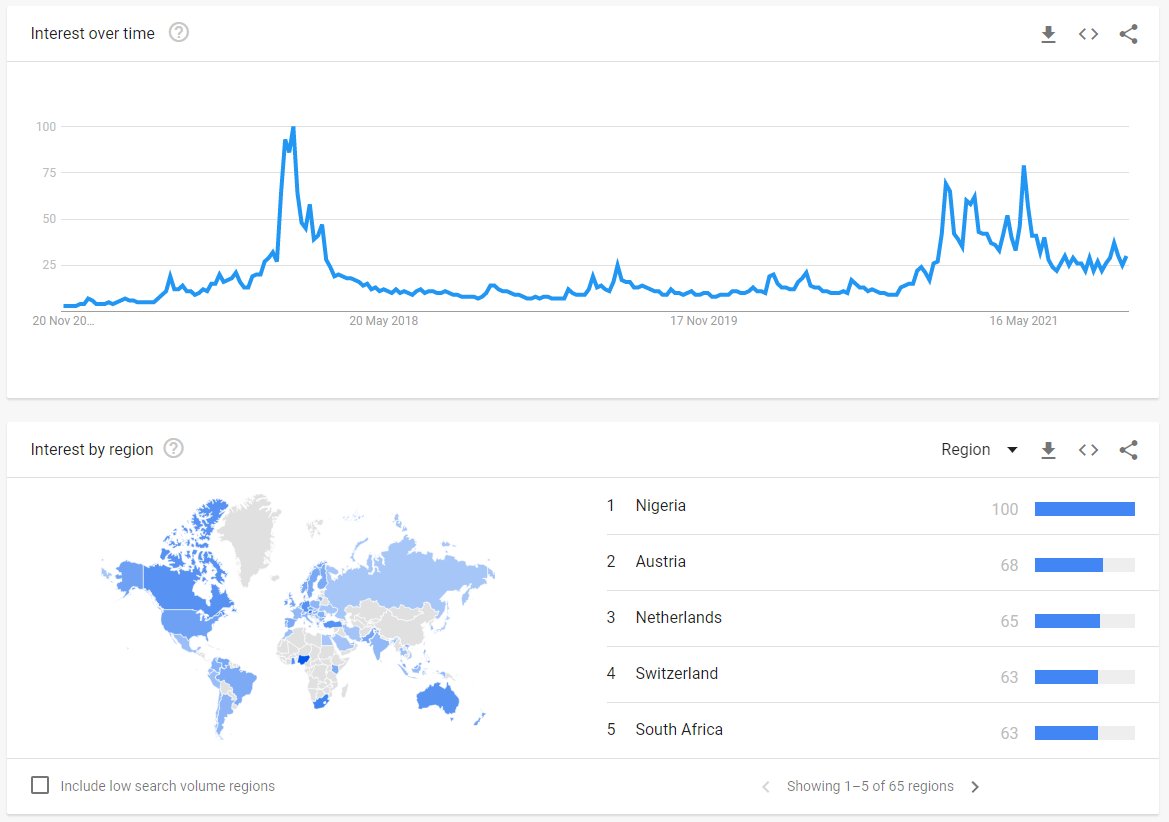
-- 2a/ Google Trends --
🔹Shows the trends on search keywords i.e. #bitcoin & #ethereum etc...
🔹The level to I want to see is between 80-90 on the yearly chart for a top to be close
🌐: trends.google.com/trends/explore…
🔹Shows the trends on search keywords i.e. #bitcoin & #ethereum etc...
🔹The level to I want to see is between 80-90 on the yearly chart for a top to be close
🌐: trends.google.com/trends/explore…
-- 2b/ Fear & Greed --
Made up of emotions & sentiments from different sources, which ave been crunched / combined into one simple number.
Be “fearful when others are greedy, and greedy when others are fearful.”
⚠️ When F&G > 90 look for tops
🌐: alternative.me/crypto/fear-an…
Made up of emotions & sentiments from different sources, which ave been crunched / combined into one simple number.
Be “fearful when others are greedy, and greedy when others are fearful.”
⚠️ When F&G > 90 look for tops
🌐: alternative.me/crypto/fear-an…


-- 3/ Weekly RSI --
When a Macro top is put in, we tend to see a clear Weekly Bearish divergence formed inside the 🐂 control zone.
Currently we have only had the first stab into the 🐂 control zone, now waiting for the 2nd and the divergence to form to mark a macro cycle top.
When a Macro top is put in, we tend to see a clear Weekly Bearish divergence formed inside the 🐂 control zone.
Currently we have only had the first stab into the 🐂 control zone, now waiting for the 2nd and the divergence to form to mark a macro cycle top.


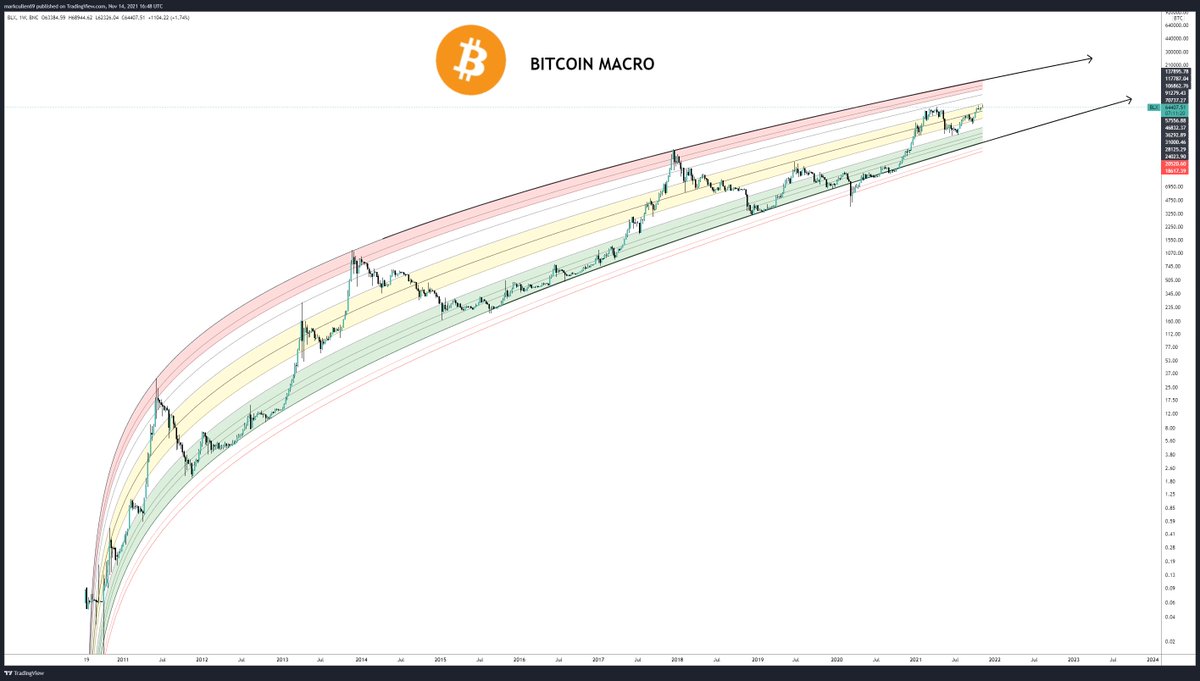
-- 4/ Log Curve --
The #Bitcoin log curve indicator, plots logarithmic curves fitted to major Bitcoin bear market tops & bottoms.
Tops are made in the 🟥 zone, bottoms in the 🟩
Currently #BTC isn't anywhere near the 🟥 zone, where a top is likely.
The #Bitcoin log curve indicator, plots logarithmic curves fitted to major Bitcoin bear market tops & bottoms.
Tops are made in the 🟥 zone, bottoms in the 🟩
Currently #BTC isn't anywhere near the 🟥 zone, where a top is likely.
-- 5/ Major Fib levels --
#Bitcoin tops have in the past 2 cycles been at or very close to the 2.272 extension of the previous 🐻market dip, see 🟥 boxes
The subsequent 🐻 market bottom has been at the 1.618 of that same fib extension, see 🟦 boxes
🔥#BTC still has a way 2 go!
#Bitcoin tops have in the past 2 cycles been at or very close to the 2.272 extension of the previous 🐻market dip, see 🟥 boxes
The subsequent 🐻 market bottom has been at the 1.618 of that same fib extension, see 🟦 boxes
🔥#BTC still has a way 2 go!

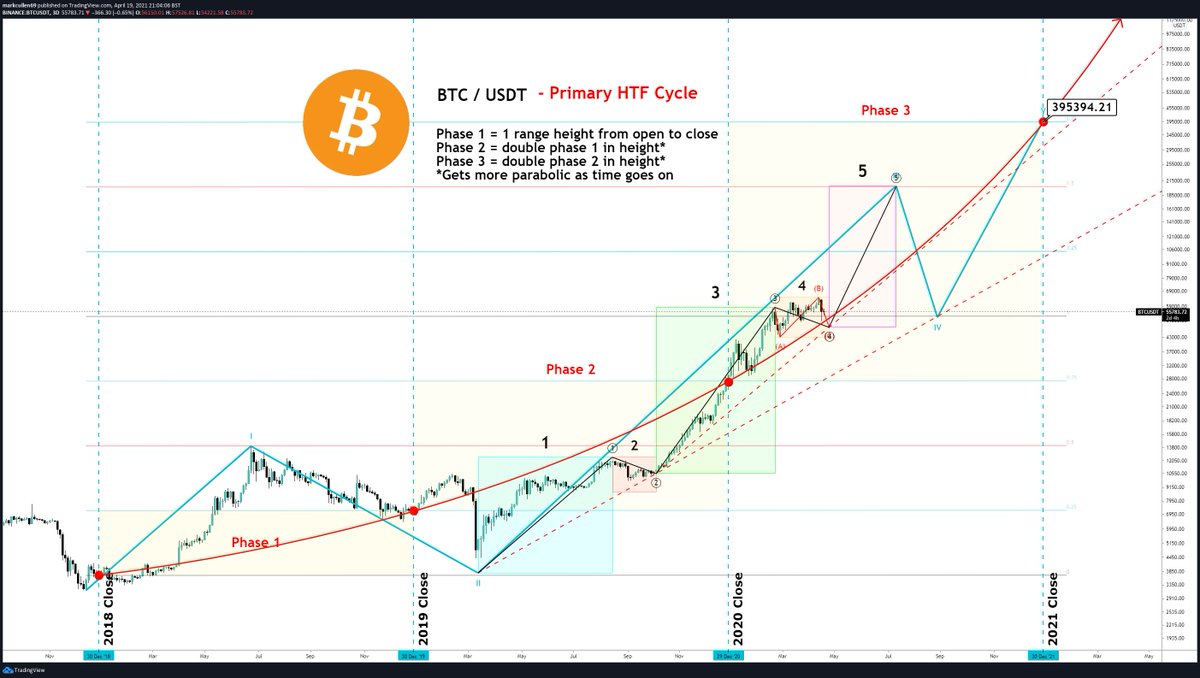
-- 6/ When to Sell?
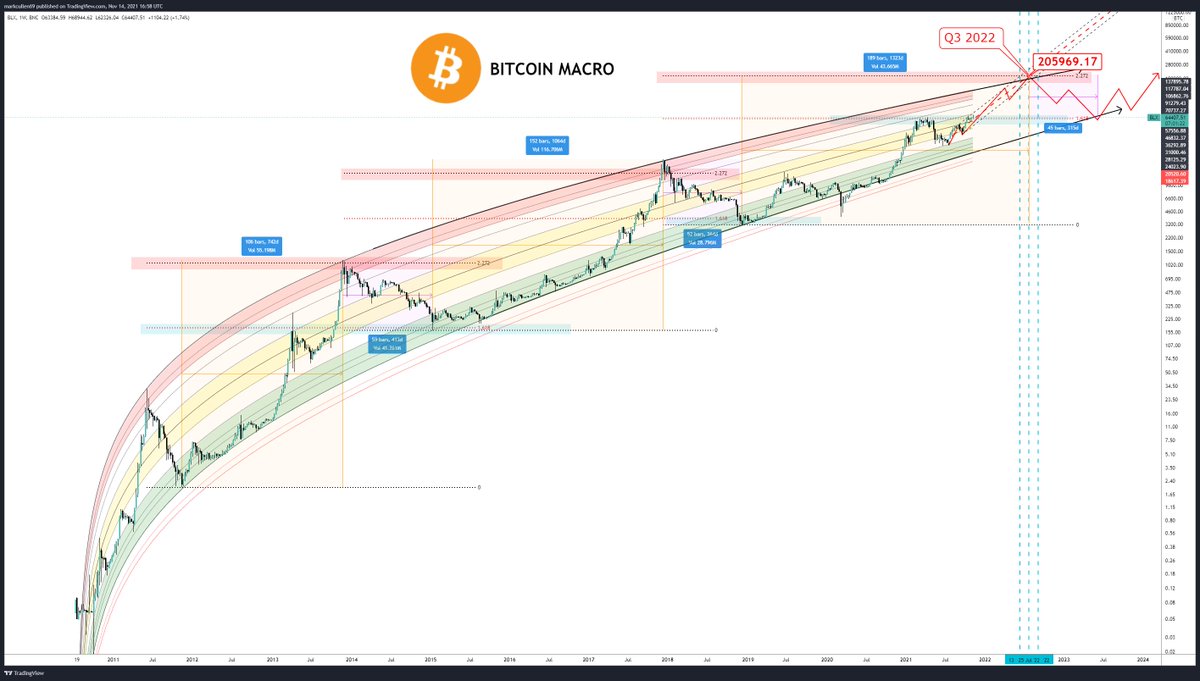
Using time of the cycles & the fact that we expect the cycles to get longer. We can extrapolate with the 2.272 fib target, the log curve 🟥 zone, pitchfork channeling and simple time expansion, that the top will be:
🔥Q2/3 2022 @ ~$200k
Using time of the cycles & the fact that we expect the cycles to get longer. We can extrapolate with the 2.272 fib target, the log curve 🟥 zone, pitchfork channeling and simple time expansion, that the top will be:
🔥Q2/3 2022 @ ~$200k
-- 7/ When to Buy back in?
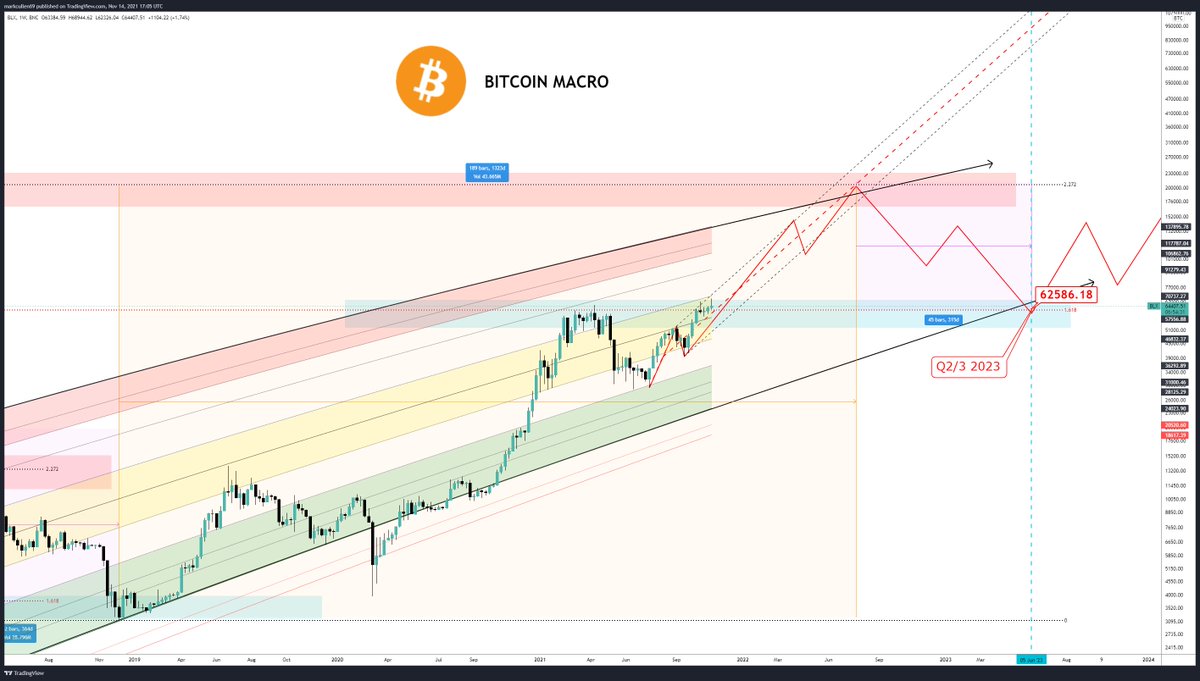
The next 🐻 bottom can also be extrapolated in a similar fashion, using the 1.618 fib level, which happens to also coincide with Support, and time in relation to previous bottoming structures.
Bear market bottom at the end of Q2/3 2023 @ at
~60K
The next 🐻 bottom can also be extrapolated in a similar fashion, using the 1.618 fib level, which happens to also coincide with Support, and time in relation to previous bottoming structures.
Bear market bottom at the end of Q2/3 2023 @ at
~60K
-- 8/ Conclusion --
🔹IMHO i think we still have a while to go before #Bitcoin tops out
🔹None of the measures or indicators are saying we have a top
🔹That said i don't think we go in a straight line, so there will be swings on the way
Please RT & Like if this was useful.
🔹IMHO i think we still have a while to go before #Bitcoin tops out
🔹None of the measures or indicators are saying we have a top
🔹That said i don't think we go in a straight line, so there will be swings on the way
Please RT & Like if this was useful.
• • •
Missing some Tweet in this thread? You can try to
force a refresh