🔥 THREAD: global fire patterns 🔥
Recent drought-related #wildfires have underscored how #climate change can increase fire risks regionally.
But various factors (e.g. human ignitions/suppression, vegetation growth) control fire, making regional fire patterns horribly complex!
Recent drought-related #wildfires have underscored how #climate change can increase fire risks regionally.
But various factors (e.g. human ignitions/suppression, vegetation growth) control fire, making regional fire patterns horribly complex!
It's tough to distill all these complexities into general statements, so here's a thread to showcase what 🛰 observations can reveal about 🔥 trends at various regional scales.
I invite you to get lost in the maps that follow and appreciate the complexity in all its glory! 🤘
I invite you to get lost in the maps that follow and appreciate the complexity in all its glory! 🤘
First up, a basic question: Where do most fires happen?
👇 Plot shows mean annual burned area during 2001-2020, summed within regions and mapped thematically.
(Note: log colour scale)
👇 Plot shows mean annual burned area during 2001-2020, summed within regions and mapped thematically.
(Note: log colour scale)

The answer depends strongly on scale. Depending on the regional layer you're looking at, you might say Africa, tropical countries, or savannahs.
Due to the sheer scale of some regions, the summed burned area within them is large (e.g. Asia/Russia/circumboreal forests).
Due to the sheer scale of some regions, the summed burned area within them is large (e.g. Asia/Russia/circumboreal forests).
Also take a look at the % contribution of fires in these regions to global burned area 👇
Now Africa and the global savannahs really jump out. *71%* of global burned area happens in savannahs! Hence, savannah fires have a massive imprint on global 🔥 trends and variability.
Now Africa and the global savannahs really jump out. *71%* of global burned area happens in savannahs! Hence, savannah fires have a massive imprint on global 🔥 trends and variability.

Important to note that these views of global pyrogeography don't account for the very different footprints of the regions shown 👆
So let's change perspective: How 'fiery' do these regions appear when their burned area is expressed as a % of their area? 👇
So let's change perspective: How 'fiery' do these regions appear when their burned area is expressed as a % of their area? 👇

It's rare for fires to burn >1% of a region's area, but savannahs in Africa and N Australia are clear outliers (>10%).
In the middle ground, fires burn ~1-10% of the area of a few ecoregions in S America (e.g. Cerrado, Chaco), SE Asia & W Eurasian steppe.
In the middle ground, fires burn ~1-10% of the area of a few ecoregions in S America (e.g. Cerrado, Chaco), SE Asia & W Eurasian steppe.
So that was a glimpse at where fires tend to happen.
How erratic are fires in these regions? Do fires burn a broadly consistent area year-on-year, or are there big peaks/troughs?
👇 Introducing inter-annual variability (IAV) expressed relative to mean annual burned area
How erratic are fires in these regions? Do fires burn a broadly consistent area year-on-year, or are there big peaks/troughs?
👇 Introducing inter-annual variability (IAV) expressed relative to mean annual burned area
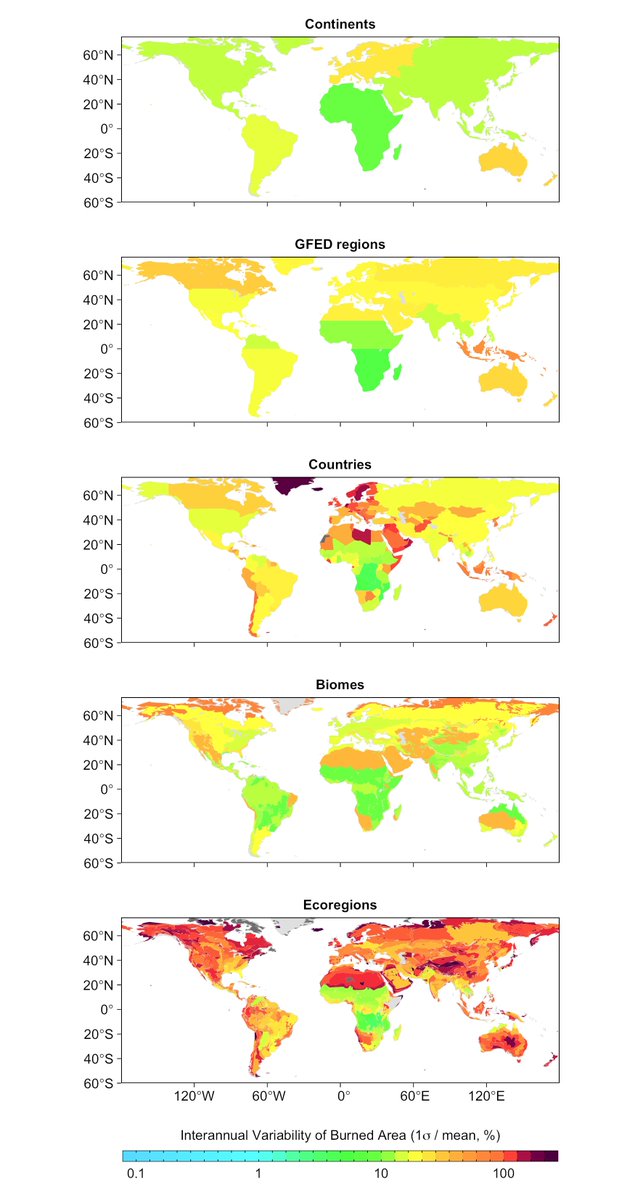
IAV is (generally) lowest in the tropics, and especially low in savannahs. It's higher in (sub)tropical drylands, where the amount of vegetation available to burn varies strongly year-on-year.
IAV is generally higher in the extratropics, notably in the N American high latitudes.
IAV is generally higher in the extratropics, notably in the N American high latitudes.
Note that IAV reduces partly with scale, reflecting the probability of a fire falling within a large vs. small area. Hence, IAV is ~lower at continental scales and ~greater at ecoregion level.
✅ Patterns
✅ Variability
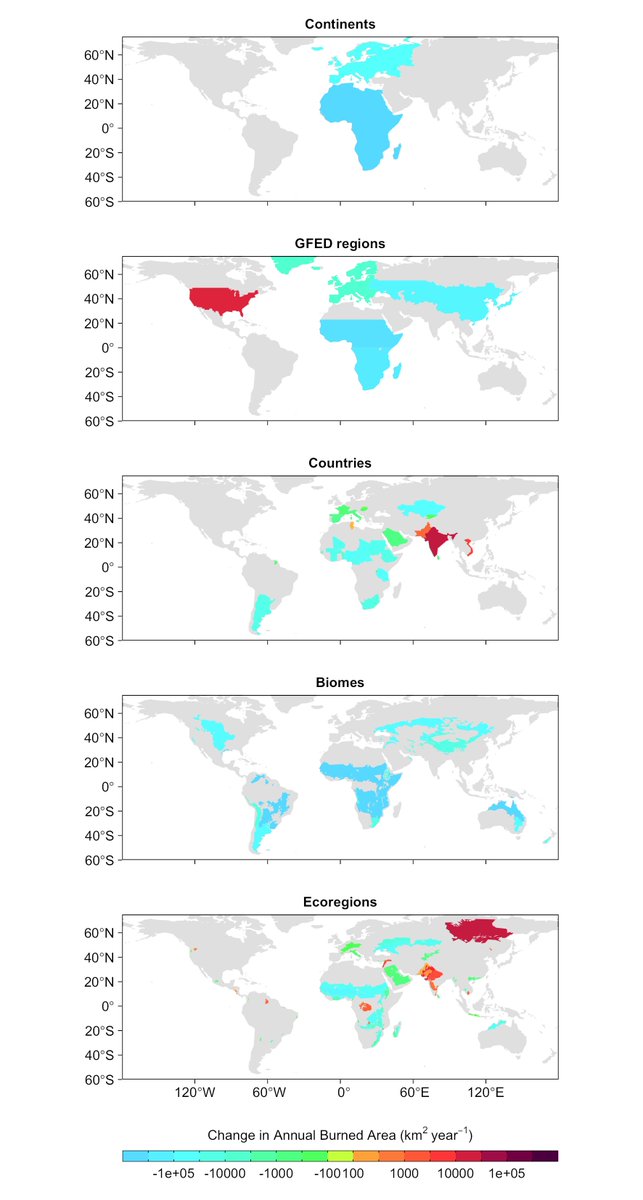
👀 Trends.
Simply put, where are fires becoming more / less prevalent?
👇 Plot shows changes in burned area by region during 2001-2020.
Note: Change (km2 year-1) = Theil-Sen slope (km2 year-2) × duration of the study period (year).
✅ Variability
👀 Trends.
Simply put, where are fires becoming more / less prevalent?
👇 Plot shows changes in burned area by region during 2001-2020.
Note: Change (km2 year-1) = Theil-Sen slope (km2 year-2) × duration of the study period (year).

Some of these maps are like patchwork quilts in places, but there are some clear 'risers', e.g.:
- Boreal forests (particularly E Siberia)
- US (scattered ecoregions, inc. W forests).
- NE China (NE).
- African equatorial forests.
- Indian subcontinent.
- SE Australian forests.
- Boreal forests (particularly E Siberia)
- US (scattered ecoregions, inc. W forests).
- NE China (NE).
- African equatorial forests.
- Indian subcontinent.
- SE Australian forests.
There are also plenty of 'fallers' e.g.:
- African & N Australian savannahs
- W Eurasian steppe
- E China
- Interior regions of South America
- African & N Australian savannahs
- W Eurasian steppe
- E China
- Interior regions of South America
Show me the trends in relative terms! I hear you say...
👇 Plot shows the change in burned area during 2001-2020 relative to the period mean.
👇 Plot shows the change in burned area during 2001-2020 relative to the period mean.
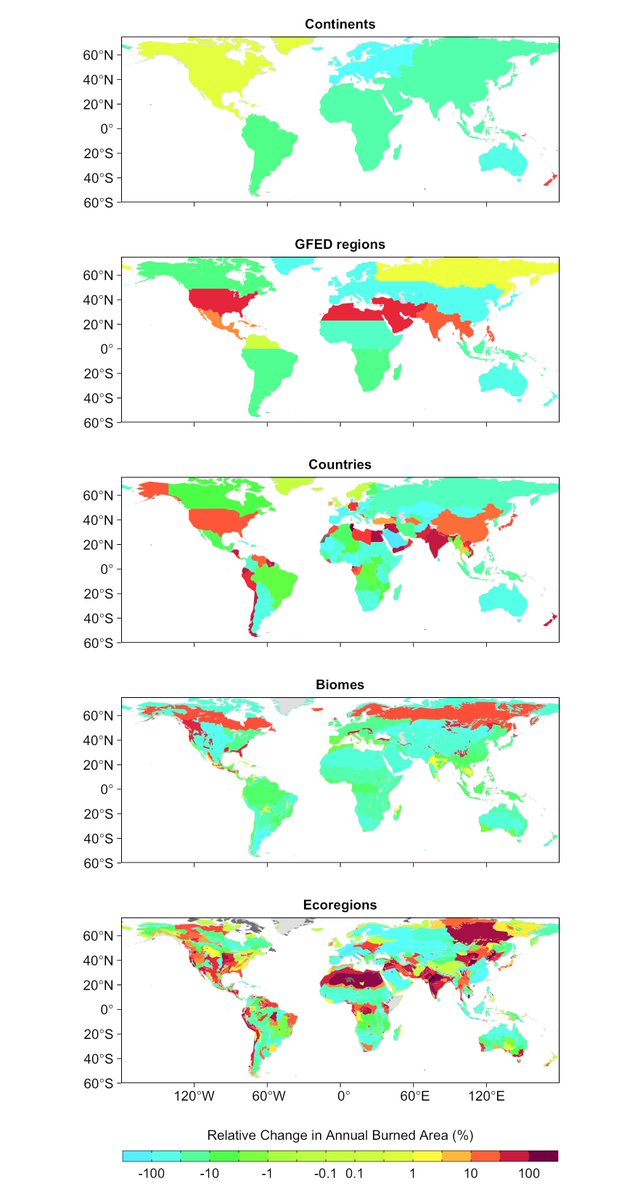
This view highlights better the negative trends in (southern) Europe, and increases in (sub)tropical drylands.
These trends are regionally substantial, but don't have such a prominent influence on the global trend in burned area as other regions.
These trends are regionally substantial, but don't have such a prominent influence on the global trend in burned area as other regions.
👇 And now, showing only the statistically significantly (p<0.05) trends.
Significant trends are pretty rare! But check out:
- (African) savannahs and S Europe for sig. negative trends
- E Siberia, the conterminous US, and the Indian subcontinent for sig. positive trends.
Significant trends are pretty rare! But check out:
- (African) savannahs and S Europe for sig. negative trends
- E Siberia, the conterminous US, and the Indian subcontinent for sig. positive trends.
So that was a whistle-stop tour of the global distribution of fire, its variability and trends over the past 2 decades.
If you made it this far, then I guess you liked diving into these maps!
Some reflective thoughts:
If you made it this far, then I guess you liked diving into these maps!
Some reflective thoughts:
1) Scale of analysis is super important. Trends seen at coarse scale mask massive differences at finer scales.
e.g. Globally, burned area has reduced by 29% during 2001-2020. The fallers (e.g. African savannahs) are trumping the risers (e.g. Siberia).
tinyurl.com/ras3y49y
e.g. Globally, burned area has reduced by 29% during 2001-2020. The fallers (e.g. African savannahs) are trumping the risers (e.g. Siberia).
tinyurl.com/ras3y49y
2) Changes in fire were substantial in some regions, but nonetheless not "significant"... because IAV is also substantial!
e.g. Trends in burned area are notoriously difficult to identify in SE Australia & Canada due to IAV.
tinyurl.com/jtcuub7w
tinyurl.com/mtawj8xu
e.g. Trends in burned area are notoriously difficult to identify in SE Australia & Canada due to IAV.
tinyurl.com/jtcuub7w
tinyurl.com/mtawj8xu
3) My sense is that fire patterns/trends in the African equatorial forests, Indian subcontinent, Eurasian steppe, global drylands have been studied less thoroughly than e.g. Amazon, Indonesia, Australia, US, Canada, tropical savannahs/forests.
Worthy of greater attention?
Worthy of greater attention?
4) Mapping data at various regional scales brings a bit of clarity to complex fire patterns... Or at least objectivity; the data reveal where the complexities lie and where generalisations do/do not hold.
5) Burned area isn't the be-all-and-end-all when it comes to studying fire patterns, but it's a good start.
tinyurl.com/45ussm8c
More threads to come on fire counts, radiative power, emissions, split of burned area by land cover, etc.
tinyurl.com/45ussm8c
More threads to come on fire counts, radiative power, emissions, split of burned area by land cover, etc.
Hope this "public service announcement" was useful in some way!
🛰 Burned area data come from #MODIS MCD64A1_006 satellite observations covering 2001-2020.
🖥️ Analyses with #RStats and plotting with #ggplot2.
🛰 Burned area data come from #MODIS MCD64A1_006 satellite observations covering 2001-2020.
🖥️ Analyses with #RStats and plotting with #ggplot2.
I'll add a page on this to my website mattwjones.co.uk at some point. Including the plotted data.
Please get in touch if:
- Something caught your eye!
- You'd like to see results for another layer of regions.
- You'd like to map out some other phenomenon in a similar way.
Please get in touch if:
- Something caught your eye!
- You'd like to see results for another layer of regions.
- You'd like to map out some other phenomenon in a similar way.
@GuidovanderWerf @pepcanadell @doerr_s @santin_cristina @FireLab_UTAD @pyrogeog @climate_guy @SallyArchibald @PFriedling @sgconard @ciais_philippe @ClimateNerilie @DrBalch @stavercarla @celsohlsj @eco_pelle @GuillermoRein @m_parrington @richardabetts @MatthewHurteau
• • •
Missing some Tweet in this thread? You can try to
force a refresh