The B.1.1.529 SARS-CoV-2 variant was first reported on 24th November 2021, and 2 days later @WHO designated it #Omicron. Since then we (me @_nickdavies @cap1024 @markjit and John Edmunds) have worked to understand potential consequences for England. 🧵 [cmmid.github.io/topics/covid19…] 

First, what do we know about Omicron?
1⃣ it has a large number of mutations (see covdb.stanford.edu/page/mutation-…)
2⃣ there is evidence from South Africa (s/out @SACEMAdirector and team) of an increased reinfection risk associated with the emergence of Omicron:
1⃣ it has a large number of mutations (see covdb.stanford.edu/page/mutation-…)
2⃣ there is evidence from South Africa (s/out @SACEMAdirector and team) of an increased reinfection risk associated with the emergence of Omicron:
https://twitter.com/SACEMAdirector/status/1466459311673159685?s=20

3⃣ Omicron neutralisation studies are emerging (~5 so far this week). These suggest a drop in neutralisation for Omicron
4⃣ @UKHSA vaccine effectiveness data suggests a significant reduction for dose 2 Omicron compared to Delta (
4⃣ @UKHSA vaccine effectiveness data suggests a significant reduction for dose 2 Omicron compared to Delta (
https://twitter.com/kallmemeg/status/1469351833416122369?s=20)

5⃣ the same @UKHSA data shows that following a Pfizer booster, vaccine effect is increased against Omicron (71.4% and 75.5% protection vs. symptomatic disease for people who received AZ and Pfizer primary courses, 2 weeks post their boosters)
khub.net/documents/1359…
khub.net/documents/1359…
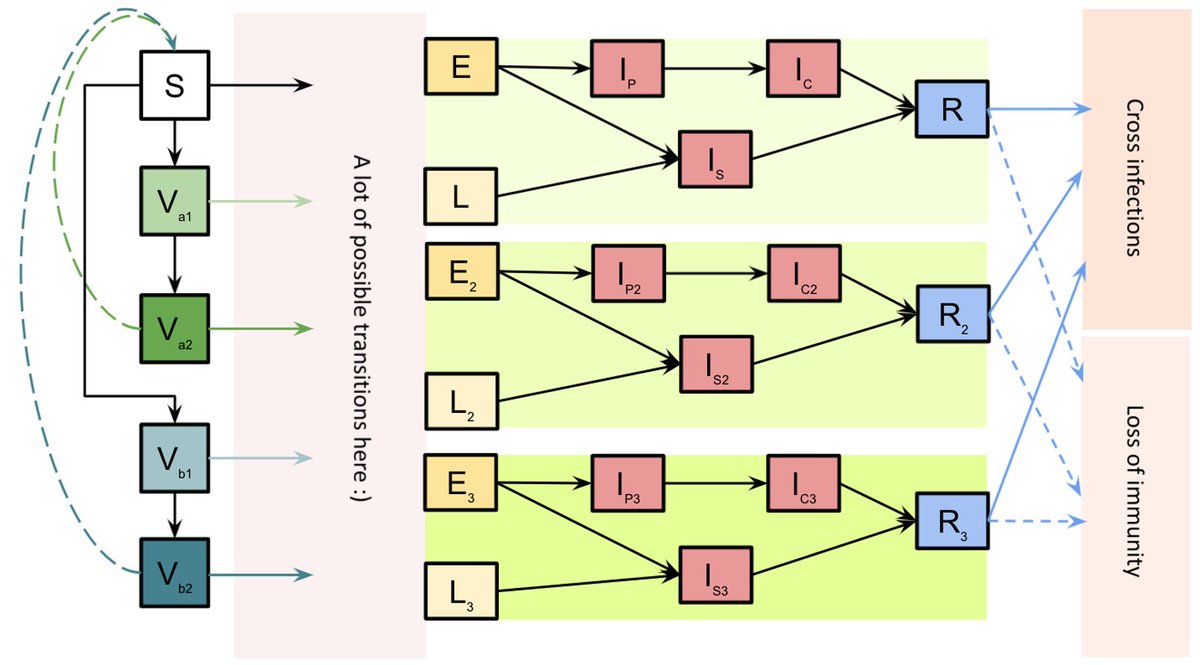
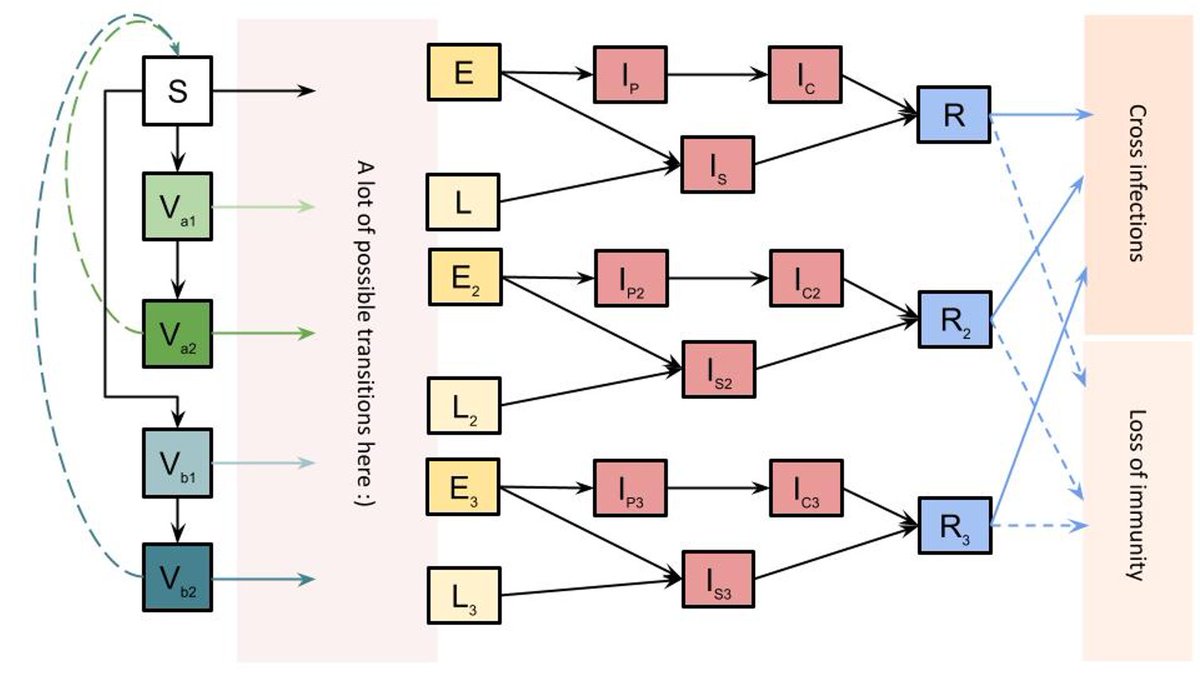
Given all of this, we adapt our existing model of SARS-CoV-2 transmission in England to include the Omicron variant.
The model is fitted to data on COVID-19 deaths, hospitalisations, PCR prevalence and seroprevalence data, as well as vaccination coverage including boosters.
The model is fitted to data on COVID-19 deaths, hospitalisations, PCR prevalence and seroprevalence data, as well as vaccination coverage including boosters.

We estimate that Omicron is exhibiting a 2.4-day doubling time in England.

Given this, we expect that Omicron will become the dominant variant in England in a matter of weeks.

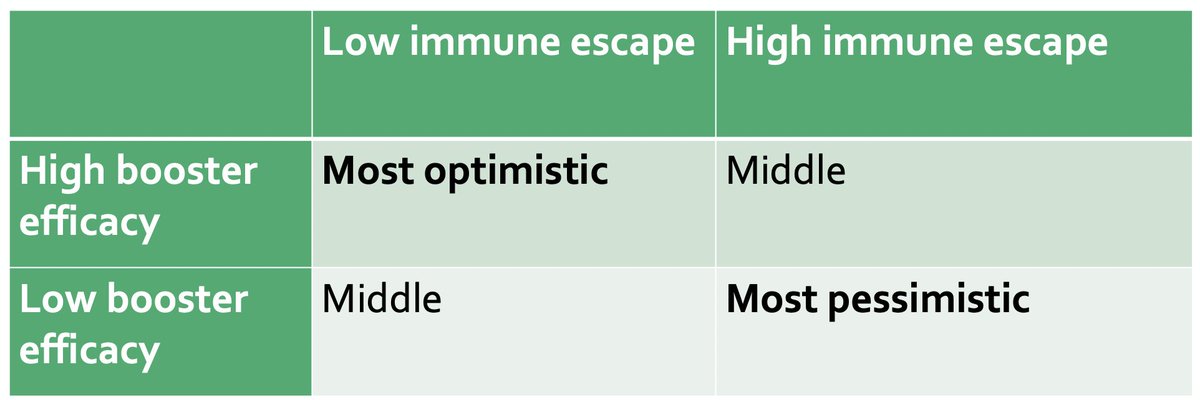
We consider two scenarios for Omicron's immune escape (5.1- and 12.8- fold reductions in neutralisation titre relative to Delta). These correspond to ~45% and ~70% reductions in vaccine protection against infection using a scaling from Khoury et al.
nature.com/articles/s4159…
nature.com/articles/s4159…
We assume vaccine protection against severe outcomes is more robust than it is against mild infection. This relationship has held for all variants so far ➡️ no reason to think this won't hold true for Omicron.
Again, we use Khoury et al. for this relationship (see above)
Again, we use Khoury et al. for this relationship (see above)
We then consider low and high scenarios for the effectiveness of booster vaccinations against Omicron: 2.5- and 4.9-fold increases in neutralisation. This gives us four main scenarios. Full details in the preprint.
Under existing control measures, we project a wave of infections resulting from Omicron that exceeds the January 2021 levels, for all four scenarios.
In the optimistic scenario, hospital admissions are projected to remain below Jan 2021 levels.
In the optimistic scenario, hospital admissions are projected to remain below Jan 2021 levels.

In the pessimistic scenario, hospital admissions are projected to exceed levels recorded in January 2021, by around 2-fold. The other scenarios are intermediate.
We also consider the introduction of control measures in addition to current "Plan B" measures.
Optimistic scenario: milder control measures can keep hospitalisations below January 2021 levels.
Pessimistic scenario: the model projects stronger control measures may be needed.
Optimistic scenario: milder control measures can keep hospitalisations below January 2021 levels.
Pessimistic scenario: the model projects stronger control measures may be needed.

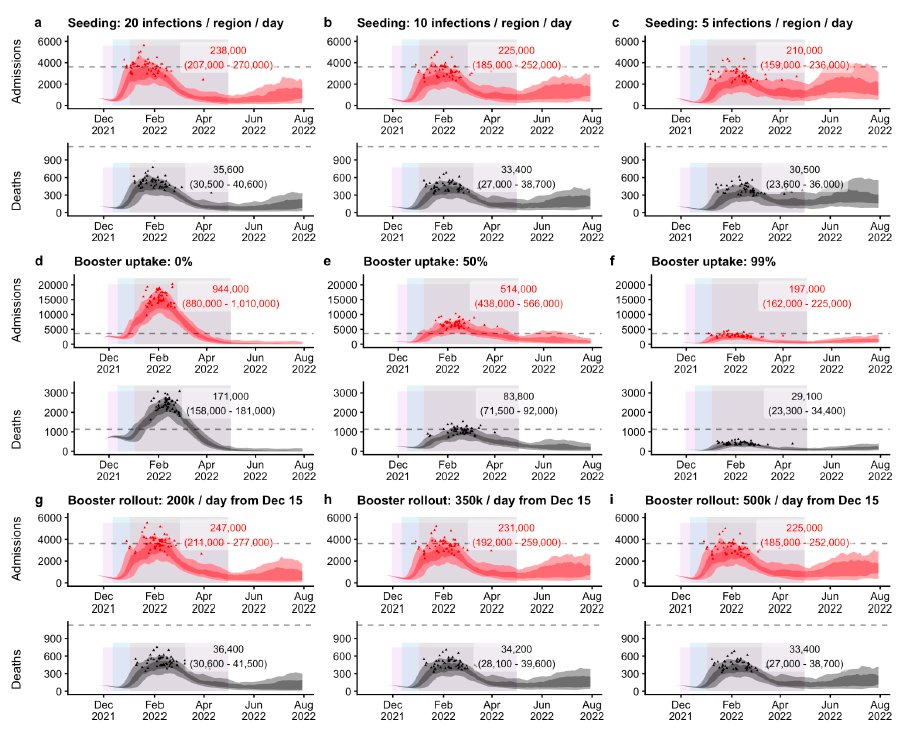
We look at sensitivity analyses for the rate of Omicron introductions into England, booster uptake, and speed of booster rollout.
Changes in introduction rate of Omicron shift the epidemic.
Booster uptake has a significant effect.
Booster rollout speed has a smaller effect.
Changes in introduction rate of Omicron shift the epidemic.
Booster uptake has a significant effect.
Booster rollout speed has a smaller effect.
Caveats:
1⃣ Data are still coming in. We will update this work continuously as new data emerges.
2⃣ We don't yet know what the severity of Omicron is. We have assumed no change in the intrinsic severity of Delta ➡️ Omicron.
1⃣ Data are still coming in. We will update this work continuously as new data emerges.
2⃣ We don't yet know what the severity of Omicron is. We have assumed no change in the intrinsic severity of Delta ➡️ Omicron.
3⃣ We assume future behaviour remains flat (we model this using mobility data)
4⃣ We only consider the epidemiological outcomes of control measures here. We do not assess their wider effects, e.g. on social, economic and wider health costs, which we know are substantial.
4⃣ We only consider the epidemiological outcomes of control measures here. We do not assess their wider effects, e.g. on social, economic and wider health costs, which we know are substantial.
Fundamentally, it's up to policy makers to weigh up all of the evidence and decide what to do about #Omicron
We can only provide evidence on the likely epidemiological outcomes.
We can only provide evidence on the likely epidemiological outcomes.
• • •
Missing some Tweet in this thread? You can try to
force a refresh