26-DEC-2021 UPDATE
1/17
New cases of #COVID19 in children and teens for the week ending December 24, 2021 - national and state trends in this 🧵
#epitwitter #PedsICU #tweetiatrician #medtwitter #OmicronVariant #DeltaVariant
covkidproject.org
1/17
New cases of #COVID19 in children and teens for the week ending December 24, 2021 - national and state trends in this 🧵
#epitwitter #PedsICU #tweetiatrician #medtwitter #OmicronVariant #DeltaVariant
covkidproject.org
26-DEC-2021 UPDATE
2/17
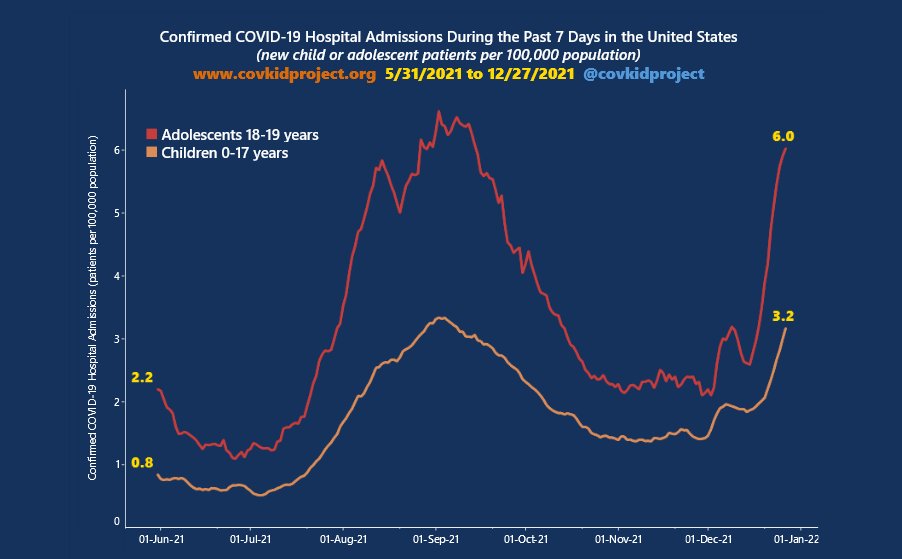
Average daily incidence of #COVID19 in children and teens ⬆️40% in one week to 51.4 new cases per 100,000 per day, approaching the #DeltaVariant surge summer high.
Keep in mind: some states only reported through 12/22 or 12/23.
covkidproject.org
2/17
Average daily incidence of #COVID19 in children and teens ⬆️40% in one week to 51.4 new cases per 100,000 per day, approaching the #DeltaVariant surge summer high.
Keep in mind: some states only reported through 12/22 or 12/23.
covkidproject.org

26-DEC-2021 UPDATE
3/17
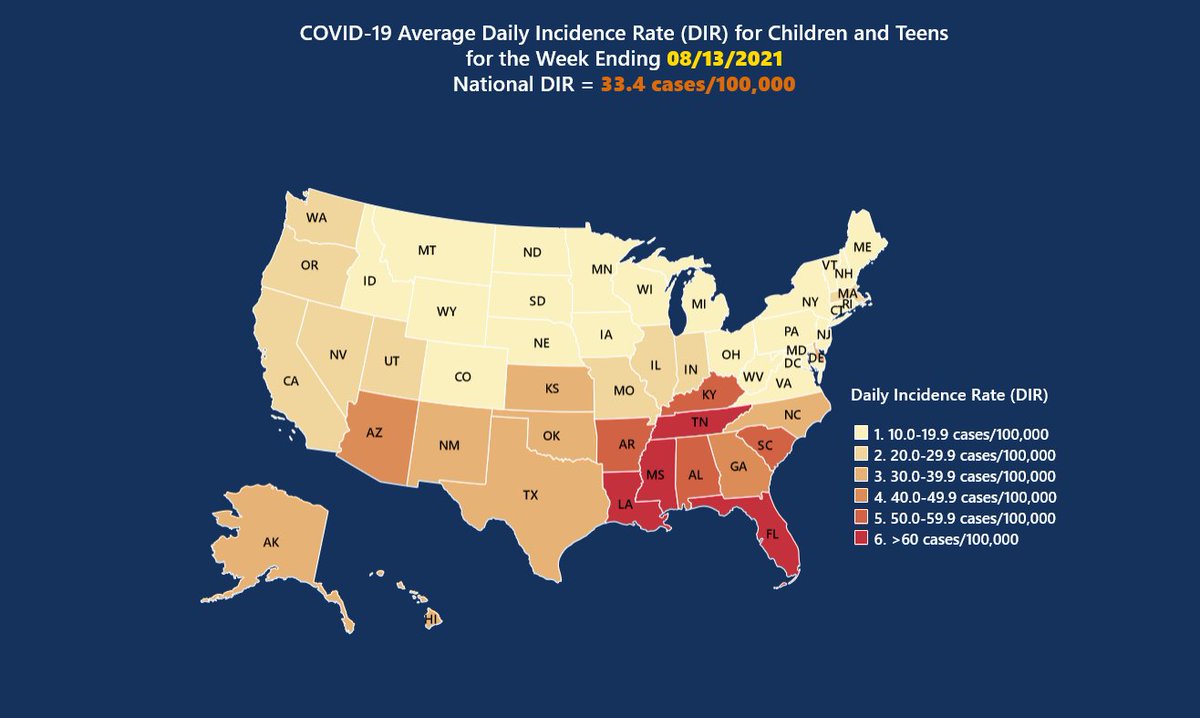
Highest ADIRs persist in New England and the Mideast, along with Illinois, Ohio, Florida --
Several states >100 new cases/100,000/day
covkidproject.org/hot-spots
3/17
Highest ADIRs persist in New England and the Mideast, along with Illinois, Ohio, Florida --
Several states >100 new cases/100,000/day
covkidproject.org/hot-spots

26-DEC-2021 UPDATE
4/17
The rate of new cases of #COVID19 in kids (ADIR) more than doubled last week in Florida, Maryland, Georgia, District of Columbia, and Hawaii.
ADIRs nearly doubled in New York, New Jersey, Louisiana.
#OmicronVariant
covkidproject.org/hot-spots
4/17
The rate of new cases of #COVID19 in kids (ADIR) more than doubled last week in Florida, Maryland, Georgia, District of Columbia, and Hawaii.
ADIRs nearly doubled in New York, New Jersey, Louisiana.
#OmicronVariant
covkidproject.org/hot-spots

26-DEC-2021 UPDATE
5/17
Time trends since November 5 in average daily incidence (ADIR) of #COVID19 in kids - ten worst states by percent ⬆️ in the past week. (Excludes DC for technical reasons.)
Very steep ⬆️ in Maryland and Florida!
covkidproject.org/hot-spots
5/17
Time trends since November 5 in average daily incidence (ADIR) of #COVID19 in kids - ten worst states by percent ⬆️ in the past week. (Excludes DC for technical reasons.)
Very steep ⬆️ in Maryland and Florida!
covkidproject.org/hot-spots

26-DEC-2021 UPDATE
6/17
In New England, where #OmicronVariant prevalence was <50% through 18-Dec per CDC, some states had ⬇️ in child/teen #COVID19 ADIRs, with rates still high due to previous #DeltaVariant surge.
Very high ⬆️ in DC may be artefactual.
covkidproject.org/hot-spots
6/17
In New England, where #OmicronVariant prevalence was <50% through 18-Dec per CDC, some states had ⬇️ in child/teen #COVID19 ADIRs, with rates still high due to previous #DeltaVariant surge.
Very high ⬆️ in DC may be artefactual.
covkidproject.org/hot-spots


26-DEC-2021 UPDATE
7/17
Florida jumped from lowest to highest ADIR of #COVID19 in kids in the Southeast last week. @CDCgov reports high prevalences of #OmicronVariant in the Southeast, so expect widening and accelerating ⬆️ across multiple states.
covkidproject.org/hot-spots
7/17
Florida jumped from lowest to highest ADIR of #COVID19 in kids in the Southeast last week. @CDCgov reports high prevalences of #OmicronVariant in the Southeast, so expect widening and accelerating ⬆️ across multiple states.
covkidproject.org/hot-spots

26-DEC-2021 UPDATE
8/17
New cases of #COVID19 in kids are ⬆️ in Illinois and Ohio. Declines in ADIR in Michigan, Minnesota, and Indiana last week indicate #OmicronVariant hasn't hit kids hard yet in those states. But ADIRs still high due to #DeltaVariant
covkidproject.org/hot-spots
8/17
New cases of #COVID19 in kids are ⬆️ in Illinois and Ohio. Declines in ADIR in Michigan, Minnesota, and Indiana last week indicate #OmicronVariant hasn't hit kids hard yet in those states. But ADIRs still high due to #DeltaVariant
covkidproject.org/hot-spots

26-DEC-2021 UPDATE
9/17
In both Plains & Southwest regions, the low point for new cases of #COVID19 in kids was mid-summer. This was right before #DeltaVariant became dominant. Now the baseline is >>higher, even before #OmicronVariant hits these regions.
covkidproject.org/hot-spots
9/17
In both Plains & Southwest regions, the low point for new cases of #COVID19 in kids was mid-summer. This was right before #DeltaVariant became dominant. Now the baseline is >>higher, even before #OmicronVariant hits these regions.
covkidproject.org/hot-spots


26-DEC-2021 UPDATE
10/17
New cases of #COVID19 in kids ⬆️ in Colorado, Hawaii last week, along with moderate ⬆️ in California, Oregon, Washington, Nevada.
covkidproject.org/hot-spots
10/17
New cases of #COVID19 in kids ⬆️ in Colorado, Hawaii last week, along with moderate ⬆️ in California, Oregon, Washington, Nevada.
covkidproject.org/hot-spots


26-DEC-2021 UPDATE
11/17
In conclusion, for the week ending 24-Dec-2021, new cases of #COVID19 in kids
⬆️ 40% for the 🇺🇸 (despite ⬇️ in several states)
⬆️ >3x in FL
⬆️ >2x in MD, GA, HI, DC
⬆️ nearly 2x in NY, NJ, LA
As #Omicron spreads, more states will suffer similar trends.
11/17
In conclusion, for the week ending 24-Dec-2021, new cases of #COVID19 in kids
⬆️ 40% for the 🇺🇸 (despite ⬇️ in several states)
⬆️ >3x in FL
⬆️ >2x in MD, GA, HI, DC
⬆️ nearly 2x in NY, NJ, LA
As #Omicron spreads, more states will suffer similar trends.

26-DEC-2021 UPDATE
12/17
Your RT helps us share accurate, unbiased data on #COVID19 in kids. Thank you 🙏
@AAPPres
@aetiology
@akjohnson1922
@AmerAcadPeds
@areinamo21
@Arrianna_Planey
@ashishkjha
@aslavitt
@astho
@BexzieGarcia
@ChandyJohnLab
@ChomiloMD
@ChrisCarrollMD
12/17
Your RT helps us share accurate, unbiased data on #COVID19 in kids. Thank you 🙏
@AAPPres
@aetiology
@akjohnson1922
@AmerAcadPeds
@areinamo21
@Arrianna_Planey
@ashishkjha
@aslavitt
@astho
@BexzieGarcia
@ChandyJohnLab
@ChomiloMD
@ChrisCarrollMD
26-DEC-2021 UPDATE
13/17
Your RT helps us share accurate, unbiased data on #COVID19 in kids. Thank you 🙏
@Cleavon_MD
@COVIDBLK
@DataDrivenMD
@DeannaMarie208
@denise_dewald
@dgurdasani1
@Dr_ScottK
@DrEricDing
@drkomanduri
@DrLeanaWen
@DrLindaMD
@DrPanMD
@DrSriram
@DrStager
13/17
Your RT helps us share accurate, unbiased data on #COVID19 in kids. Thank you 🙏
@Cleavon_MD
@COVIDBLK
@DataDrivenMD
@DeannaMarie208
@denise_dewald
@dgurdasani1
@Dr_ScottK
@DrEricDing
@drkomanduri
@DrLeanaWen
@DrLindaMD
@DrPanMD
@DrSriram
@DrStager
26-DEC-2021 UPDATE
14/17
Your RT helps us share accurate, unbiased data on #COVID19 in kids. Thank you 🙏
@DrSteveCook
@DrTomFrieden
@DrTomori
@DrZoeHyde
@elliemargolis
@EpiEllie
@EricTopol
@ForlornTheresa
@GabrielScally
@gbosslet
@gradydoctor
@GYamey
@heather_haq
14/17
Your RT helps us share accurate, unbiased data on #COVID19 in kids. Thank you 🙏
@DrSteveCook
@DrTomFrieden
@DrTomori
@DrZoeHyde
@elliemargolis
@EpiEllie
@EricTopol
@ForlornTheresa
@GabrielScally
@gbosslet
@gradydoctor
@GYamey
@heather_haq
26-DEC-2021 UPDATE
15/17
Your RT helps us share accurate, unbiased data on #COVID19 in kids. Thank you 🙏
@hospitals4kids
@JanelleMMenard
@JasonSalemi
@JennaMillerKC
@JHowardBrainMD
@jljcolorado
@JPHMPDirect
@KateClancy
@KimberlyPrather
@KYT_ThatsME
@LauraMiers
@LeeBeers
15/17
Your RT helps us share accurate, unbiased data on #COVID19 in kids. Thank you 🙏
@hospitals4kids
@JanelleMMenard
@JasonSalemi
@JennaMillerKC
@JHowardBrainMD
@jljcolorado
@JPHMPDirect
@KateClancy
@KimberlyPrather
@KYT_ThatsME
@LauraMiers
@LeeBeers
26-DEC-2021 UPDATE
16/17
Your RT helps us share accurate, unbiased data on #COVID19 in kids. Thank you 🙏
@LongCovidKids
@Michigan_Noah
@NACCHOalerts
@nonprofitorgs
@npdcoalition
@pccm_doc
@PeterHotez
@PIPSQC
@PublicHealth
@RheaBoydMD
@rwjf
@SapnaKmd
@SuzeQKnits
16/17
Your RT helps us share accurate, unbiased data on #COVID19 in kids. Thank you 🙏
@LongCovidKids
@Michigan_Noah
@NACCHOalerts
@nonprofitorgs
@npdcoalition
@pccm_doc
@PeterHotez
@PIPSQC
@PublicHealth
@RheaBoydMD
@rwjf
@SapnaKmd
@SuzeQKnits
26-DEC-2021 UPDATE
17/17
Your RT helps us share accurate, unbiased data on #COVID19 in kids. Thank you 🙏
@Theresa_Chapple
@uche_blackstock
@WesElyMD
@WhitneyEpi
@yaneerbaryam
@yoncabulutmd
@yoreekoh
17/17
Your RT helps us share accurate, unbiased data on #COVID19 in kids. Thank you 🙏
@Theresa_Chapple
@uche_blackstock
@WesElyMD
@WhitneyEpi
@yaneerbaryam
@yoncabulutmd
@yoreekoh
• • •
Missing some Tweet in this thread? You can try to
force a refresh