In this thread I am sharing Trading Setup, which can be used to find 𝑹𝒆𝒗𝒆𝒓𝒔𝒂𝒍 𝑺𝒕𝒐𝒄𝒌𝒔 after a 𝑫𝒐𝒘𝒏𝒕𝒓𝒆𝒏𝒅.
I have shared such trading setups in the past as well.
Like❤️& Retweet🔄for wider reach and for more such learning thread in the future.
1/10
I have shared such trading setups in the past as well.
Like❤️& Retweet🔄for wider reach and for more such learning thread in the future.
1/10
🔴Crucial Moving Average (#EMA)
Generally, all stocks have tendencies to retrace back to EMA and this is called Mean Reversion.
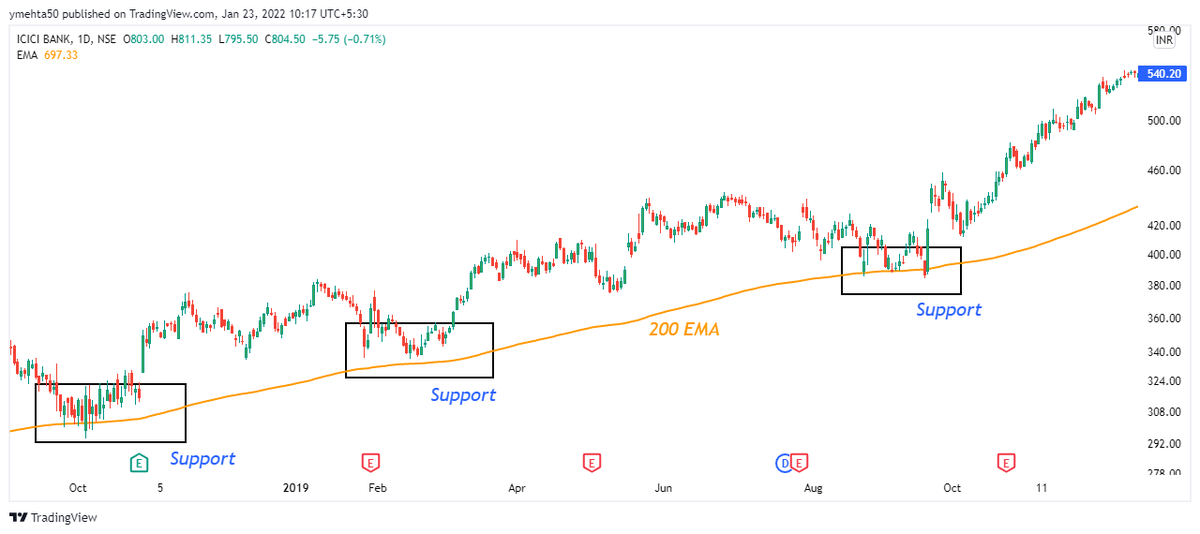
200 EMA is a crucial one which can be used to find support for stocks during downtrend.
It works on Daily, Weekly and Monthly time frame.
2/10
Generally, all stocks have tendencies to retrace back to EMA and this is called Mean Reversion.
200 EMA is a crucial one which can be used to find support for stocks during downtrend.
It works on Daily, Weekly and Monthly time frame.
2/10
I would prefer to do backtest on the stock and see how it had reacted when it approaches near crucial EMA in the past.
Sharing some examples where stock took support near EMA:
1⃣ ICICI Bank - Daily
2⃣ TCS - Weekly
3⃣ Cipla - Monthly
3/10
Sharing some examples where stock took support near EMA:
1⃣ ICICI Bank - Daily
2⃣ TCS - Weekly
3⃣ Cipla - Monthly
3/10


🔴#Fibonacci Retracement
When a stock is in uptrend and in uncharted territory, then important fibonacci levels can act as support.
Retracement levels are: 23.6%, 38.2%, 61.8% and 78.6%.
Plot Fibo from low to high in the uptrend and Retracement levels will be plotted.
4/10
When a stock is in uptrend and in uncharted territory, then important fibonacci levels can act as support.
Retracement levels are: 23.6%, 38.2%, 61.8% and 78.6%.
Plot Fibo from low to high in the uptrend and Retracement levels will be plotted.
4/10
Again Fibonacci Retracement works on Daily, Weekly and Monthly Time Frame.
Sharing some examples where stock took support near Retracement levels:
1⃣ Reliance Ind - Daily
After uptrend from 867 to 2369, Reliance took support at 38.2% retracement level.
5/10
Sharing some examples where stock took support near Retracement levels:
1⃣ Reliance Ind - Daily
After uptrend from 867 to 2369, Reliance took support at 38.2% retracement level.
5/10

🔴Price Action
Identifying Stocks that are trading near support line.
DMart was trading near support line on daily time frame. It took support and bounced back.
6/10
Identifying Stocks that are trading near support line.
DMart was trading near support line on daily time frame. It took support and bounced back.
6/10

Identifying Stocks that are retesting near the breakout region.
Again DMart chart on weekly time frame.
After breakout, price has retested near breakout region, which gave good opportunity to #trader/#investor to buy near that level.
Price took support there and rallied.
7/10
Again DMart chart on weekly time frame.
After breakout, price has retested near breakout region, which gave good opportunity to #trader/#investor to buy near that level.
Price took support there and rallied.
7/10

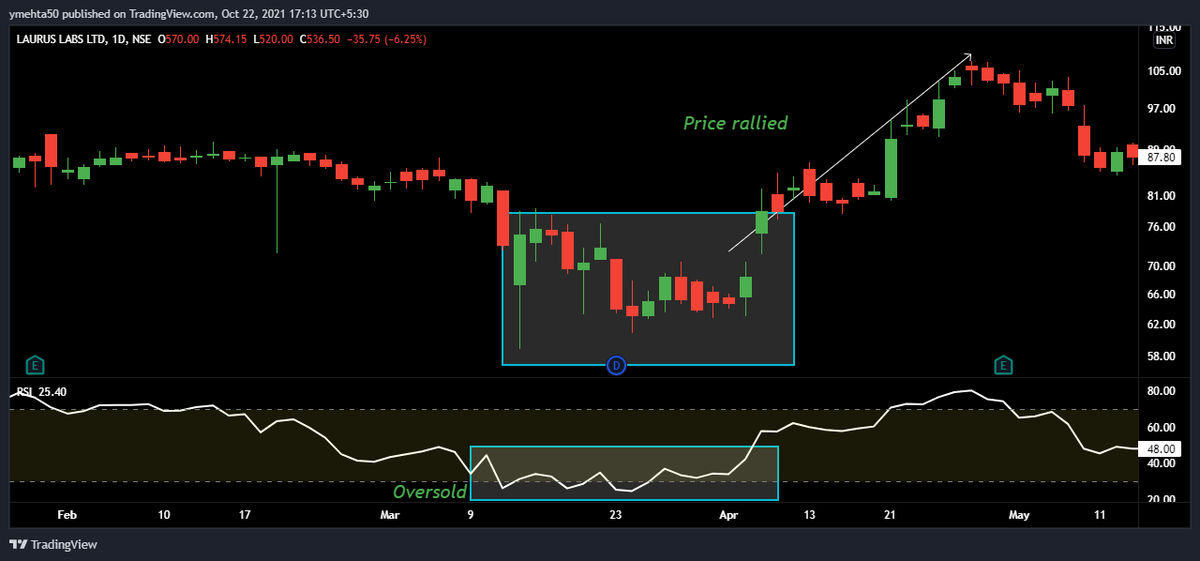
🔴Bullish RSI Divergence
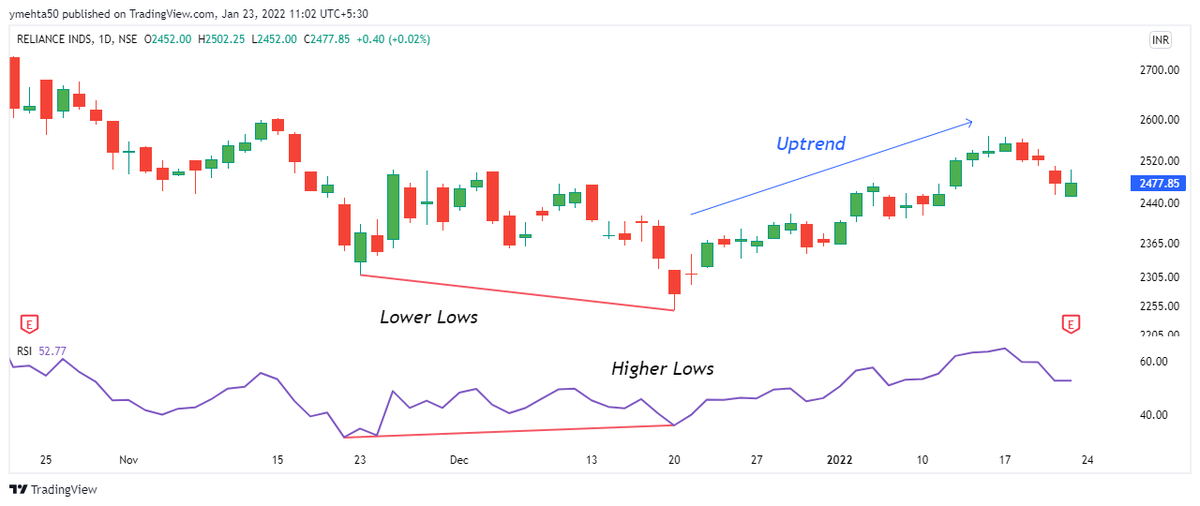
Price is forming Lower Lows and RSI is forming Higher Lows. This means momentum of downtrend is fading out and reversal is possible.
Shared chart of Reliance Daily time frame where Bullish Divergence was formed and then price rallied.
8/10
Price is forming Lower Lows and RSI is forming Higher Lows. This means momentum of downtrend is fading out and reversal is possible.
Shared chart of Reliance Daily time frame where Bullish Divergence was formed and then price rallied.
8/10
All these simple strategies or trading setup I used to find out reversal stocks for short-term trading or investment.
This I use only for buying in cash for finding out low risk buying opportunity. Trading in futures/options will be risky without a proper trading plan.
9/10
This I use only for buying in cash for finding out low risk buying opportunity. Trading in futures/options will be risky without a proper trading plan.
9/10
I hope everyone understood how reversal stocks can be identified.
These are not a universal rules one must follow. One can create their rule or follow different rules.
Only important thing is one must follow a fix rule with a proper trading plan without tweaking it.
10/10
These are not a universal rules one must follow. One can create their rule or follow different rules.
Only important thing is one must follow a fix rule with a proper trading plan without tweaking it.
10/10
• • •
Missing some Tweet in this thread? You can try to
force a refresh