ZBF release finally draws closer (zero2050usa.com). We have been working to get the data/report out & understandable. Here is a short thread with some interesting observations that we made. First, here is a cheat sheet for our scenarios (a wide spread of possibilities) 

First, we find that scenarios have huge amounts of #wind & #solar. We also find that deployment rates for these (& #storage) must dramatically increase to reach our goals (with and without novel generation).


This becomes increasingly important for limited technology cases & huge for #storage in terms of energy capacity.


Of course, we are creating a #clean #economy in these scenarios, so #electrification plays a dramatic role in needing more electricity & in doing so needing more generation. The needs are met very differently and in a limited technology case the #curtailment rate skyrockets.

This is with sector coupling, #hydrogen production for #industry, #demand #flexibility, & in half scenarios an #HVDC macrogrid. In fact, because of the high resolution grid topology, we see the true scale of the #transmission needs across the #US.

In the scenarios, we find that electric #storage acts more as diurnal balancing, while #hydrogen production acts more as #seasonal/long duration storage. There can be shifts to how technologies interact, but both appear necessary. These work in concert with the #transmission.


These #scenarios meet the demand in different ways, but always keep the #grid powered at 5-minute 3-km resolution for multiple years. This comes at a cost of needing more #transmission than expected, more #storage, and more #dense #clean #generation.


This leads to very different behaviours to cope with #system #stress when generation becomes tight. There are #physical limits to demand flexibility (both equipment size & environment).


We do find as others have (@JesseJenkins, Williams, @VibrantCE before, @IPCC_CH, @KenCaldeira, etc) that having more generation technologies (particularly dense, clean transmission, & storage) reduces the costs of the system & makes them easier to operate.
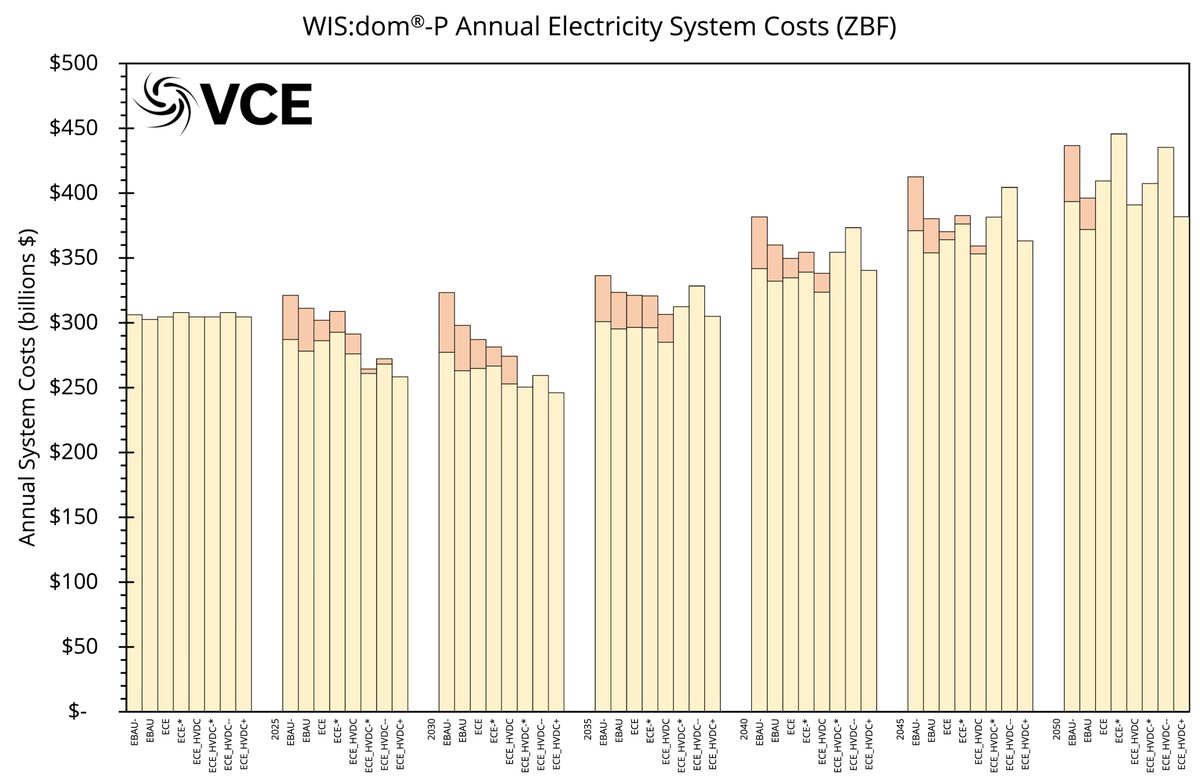

More on the "easier to operate" another time. Note the darker bar in the previous tweet is additional costs required for #DACs to remove excess CO2 emissions. The scenarios are all lower cost that today in terms of retail rates. This is critical for #electrification adoption.
All the scenarios are designed to reduce GHG emissions to almost zero across the economy by 2050. This is achieved, but excess emissions are removed via DACs (with estimated costs) to determine the additional burden across those chosen pathways.

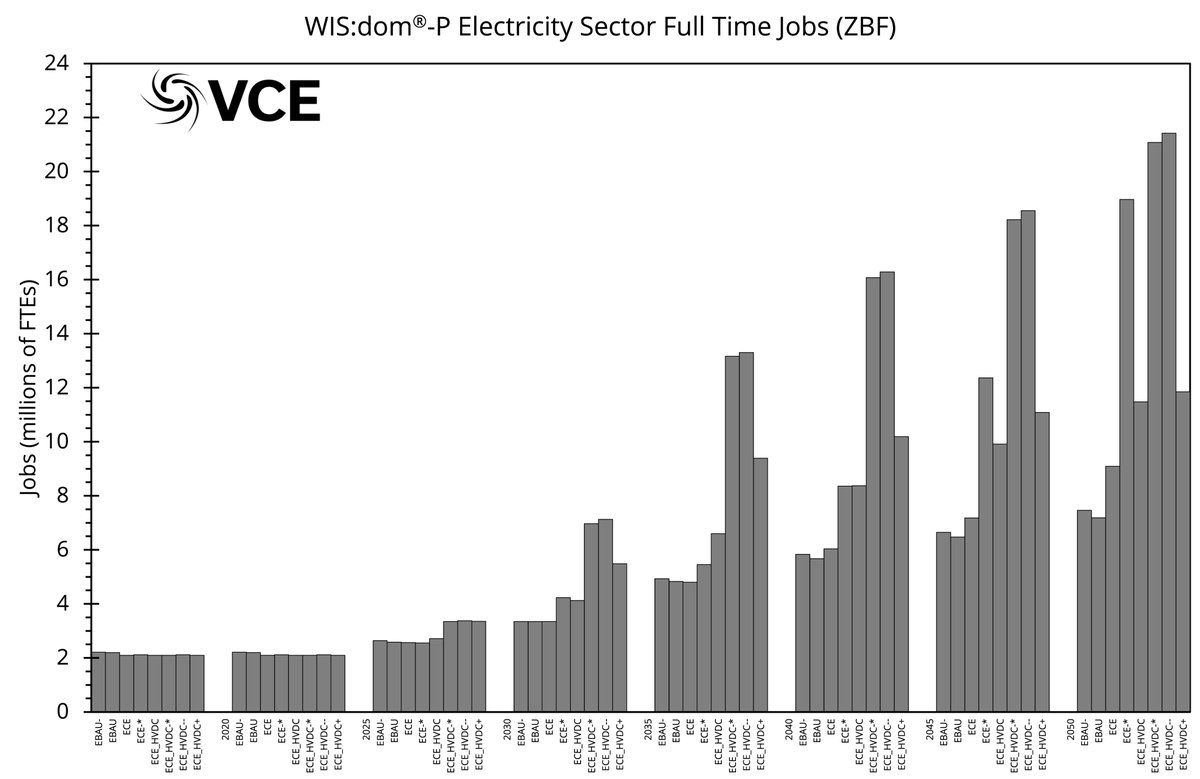
Finally, we have more to come on land use (these scenarios use between 40,000 and 60,000km2 for energy production) in the reports as well as how distribution co-optimization assists with lowering costs. For now, I will leave you with the estimated job growth.
Thoughts, comments, clarity critiques are all welcomed. Remember the data is already available at zero2050usa.com. More will be uploaded & would love to work with others to expand analysis & compared with other studies for a repository that is easier for everyone to find!
@bslotterback @brendanpierpont @joshdr83 @MichaelEWebber @AukeHoekstra @cleantechsonia @oboylemm @VibrantCE @JesseJenkins @MBazilian @dan_kammen @achoukulkar @KetanJ0 @ramez
One final, final note. When you limit technologies & rely more on #storage, some very interesting behaviour with the fleet for charging & discharging occurs. Essentially, it become more dependent at lower stress levels of the grid. Therefore, smaller issues cause bigger problems.


@dog4climate @maggie_shober @PauliJllo @inesliaz @taylormmcnair @ErinNMayfield @krismayes @rachelkatiegold @A_Siegel @JaneAFlegal @CasparyJay @RobertFares @drvolts @bobbyllew @S_HastingsSimon @SimonMahan
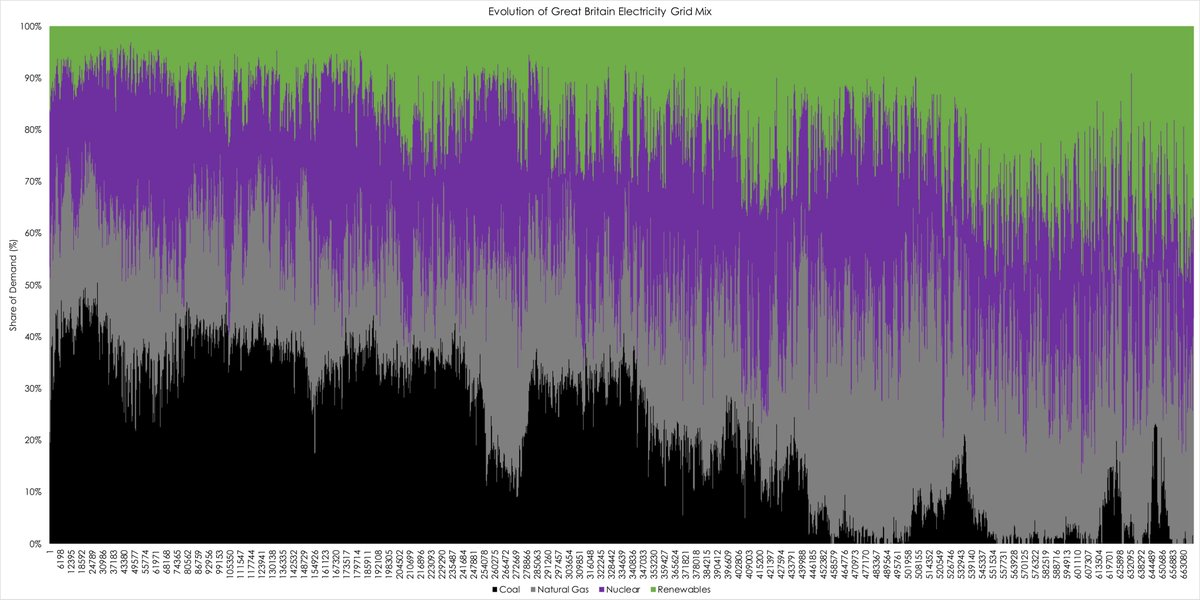
One thing I found interesting is that in the EBAU scenario, the model still reaches the old 80x50 easily. However, natural gas still large component of electricity generation.
• • •
Missing some Tweet in this thread? You can try to
force a refresh