1/ Bear markets are notorious for brutal fakeouts, which is why it's critical to identify targets and invalidations.
Here are key levels to watch in both directions.📉📈
#BTC analysis 🧵
#NFA
More from Material Indicators here... mi1.pw/mitwmay
Here are key levels to watch in both directions.📉📈
#BTC analysis 🧵
#NFA
More from Material Indicators here... mi1.pw/mitwmay
2/In bear markets everyone is looking for a relief rally to exit or add short. Those are good strategies if you can tell the difference between a fakeout and a breakout. #FOMO + failure to identify invalidation levels are why so many people get rekt. #BullTrap #ShortSqueeze
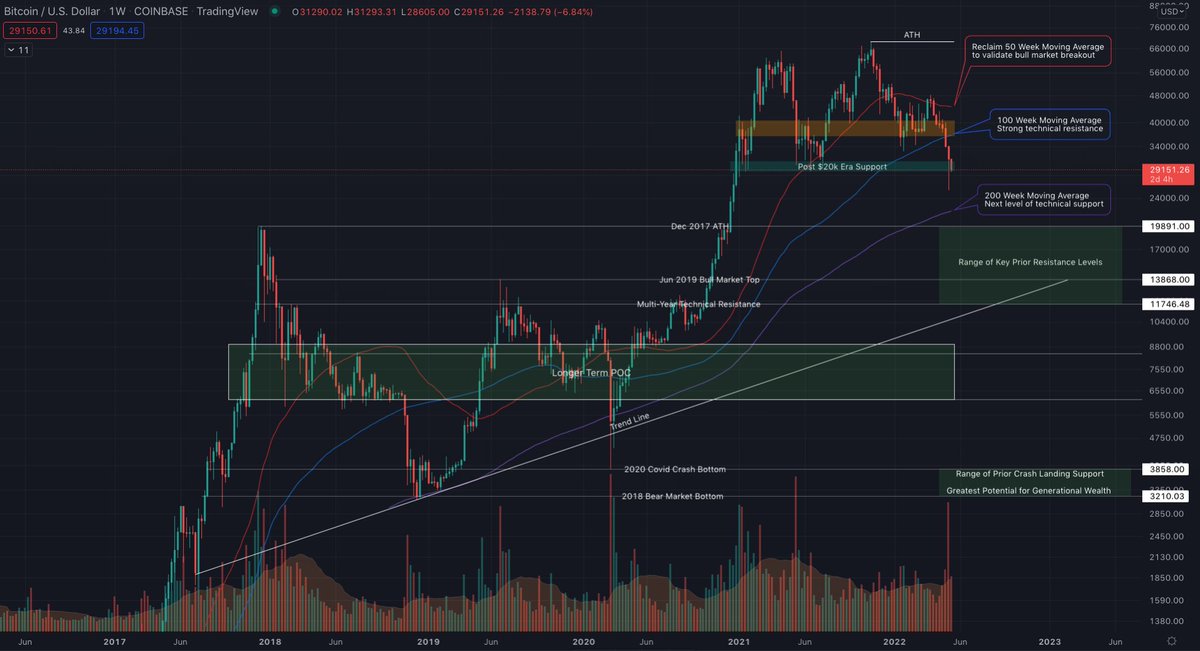
3/ Identifying targets is easy. Determining breakout or fakeout is more challenging, and while there are no sure things, there are some things we can look at to help mitigate risk of getting trapped. To get some perspective, let's start with an ultra wide macro view of #BTC

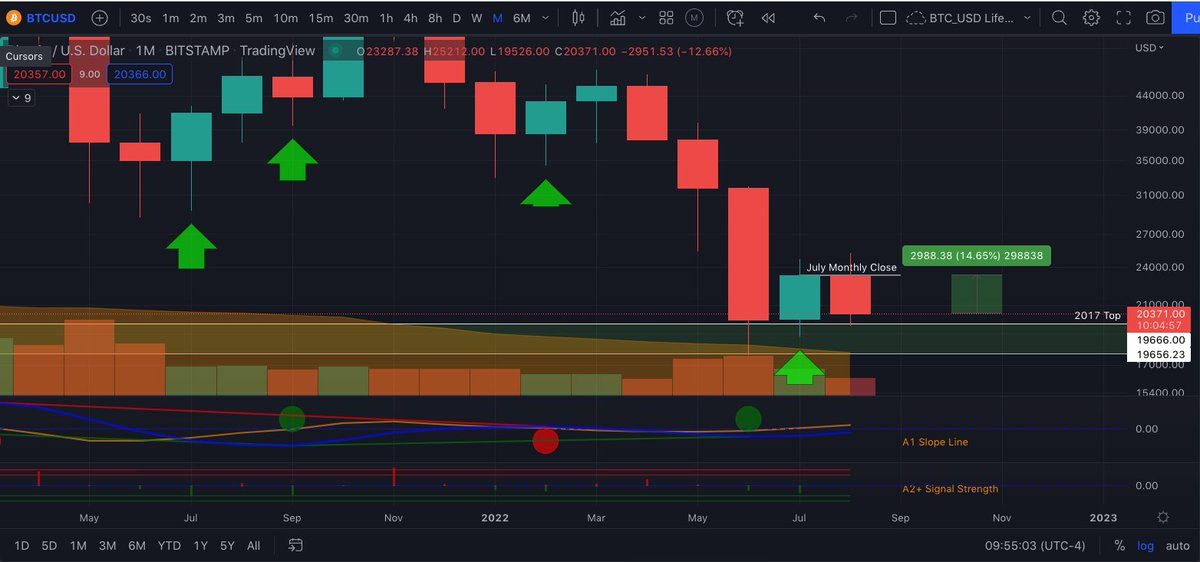
4/ Looking at the W lifetime #Bitcoin chart on log scale we can see a bullish channel, how interactions with the 100 and 200 WMA have played out and the confluence between the 200 WMA and the bottom of the channel. Technical Analysts view the 200 WMA a downside target, but...
5/ ...because the obvious targets are often overshot to shakeout weak hands and TA doesn't always hold up during a #BlackSwan event, it's important to identify more potential targets. Zooming into the last 5 years we can see the trend has shifted downward.

6/ Regardless of the sentiment around the 200 WMA, if you aped in without confirming it would hold or didn't use a stop loss to protect from too much downside, the losses could be catastrophic.

7/ There is also no guarantee the lower target would hold, which is why it's important to identify a range of targets that have served as R/S levels in the past, that could validate why #BTC price might bounce or consolidate at that level before the next leg up or down.

8/ Unless an asset is in price discovery, you aren't likely to see R/S or consolidation in arbitrary places. The areas of prior R/S and consolidation are like a magnet to price. Now consider #sentiment as the strength of that magnet which could draw price up or down.
9/ So how do you measure price #sentiment?
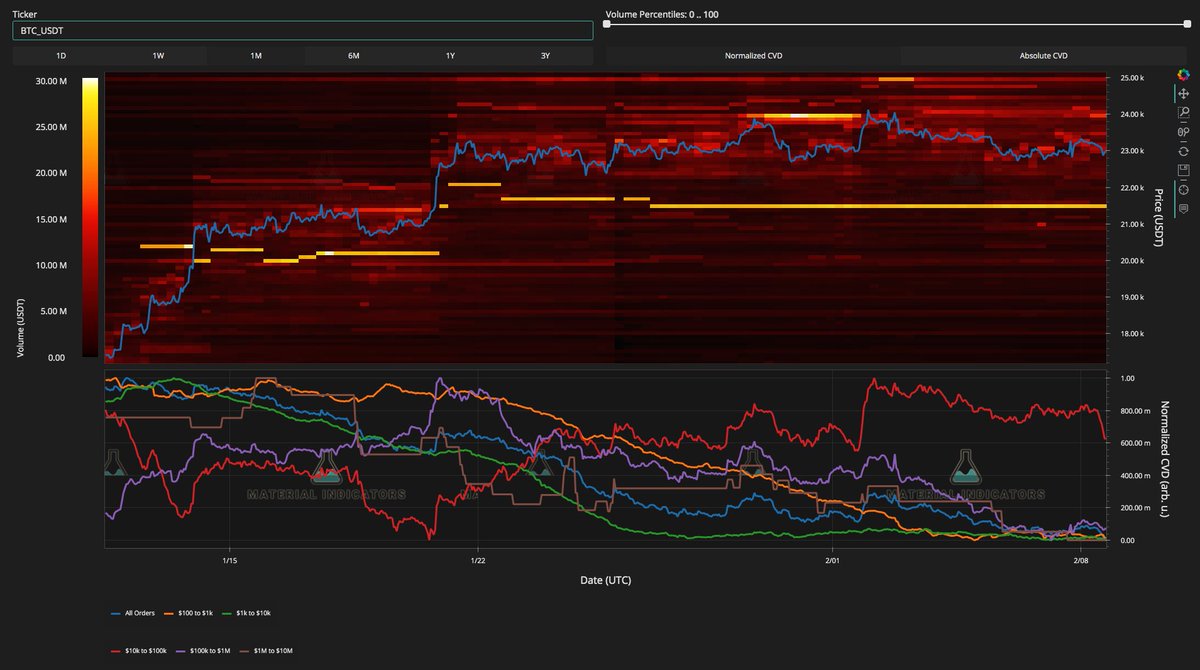
IMO, not on CT. Better to use verifiable metrics like volume relative to price ranges and order book data.
Let's start with volume...
Volume candles can tell you a lot.
VPVR (Volume Profile Visible Range) can tell you even more.
IMO, not on CT. Better to use verifiable metrics like volume relative to price ranges and order book data.
Let's start with volume...
Volume candles can tell you a lot.
VPVR (Volume Profile Visible Range) can tell you even more.

10/ VPVR will mark the POC (Point of Control) relative to the range you are showing. Now that we've lost the post $20k era POC, we need to zoom out to the range we think may come into play. Doing so illustrates the price range #BTC has spent the most time since 2016.

11/ Identifying the longer term POC in the middle of the $6k - $9k range does not mean price is going to go there, but if it goes anywhere near it or below it, that range will act as validation / invalidation for long term support and resistance as it has done many times before.
12/ If liquidity = price #sentiment, another #dataviz tool we can use to gain some insight is #FireCharts which shows where liquidity is concentrated in the order book. Analysts are calling the 100 WMA level at $36.6k resistance, yet there is more volume at $32k and $35k.

13/ Zooming out shows #BTC bid liquidity laddered past $20k, yet there isn't any concentration of volume that looks similar to areas that marked trend reversals. Liquidity tends to appear as price nears zones where price sentiment is high. RN, none of this resembles prior bottoms

There are a many catalysts that could trigger a #BlackSwan event that leads to the bottom or a rally that leads to a retest of the ATH. Positive or negative factors around inflation, war and covid seem like good candidates, but there is no telling if or when we get that.
14/ That's why it's important to identify a range of potential targets to use as reference points as the downtrend continues, and to identify the levels you will use to confirm or invalidate price assumptions before you ape in to a trade from any given level.

15/ Look how many times #BTC price has flirted with the edges of this range this week. No telling how many people got rekt on fakeouts because they didn't wait for confirmations. Waiting for full candle body open/closes may sacrifice some profit, but it mitigates a heap of risk.

16/ I hope you found this helpful. If you did, please RT.
More from Material Indicators here... mi1.pw/mitwmay
Join our free global community of #CryptoTraders on @telegram here... mi1.pw/mitwtg
More from Material Indicators here... mi1.pw/mitwmay
Join our free global community of #CryptoTraders on @telegram here... mi1.pw/mitwtg
• • •
Missing some Tweet in this thread? You can try to
force a refresh