#PreMarketCapsule | 5th September, Monday | Edition: 34

In the document ⬇️
1. #Nifty Range and Breadth
2. #Banknifty range and Breadth
3. #Sector Breadth
4. #FII Derivative Activity
5. #Summary of the analysis
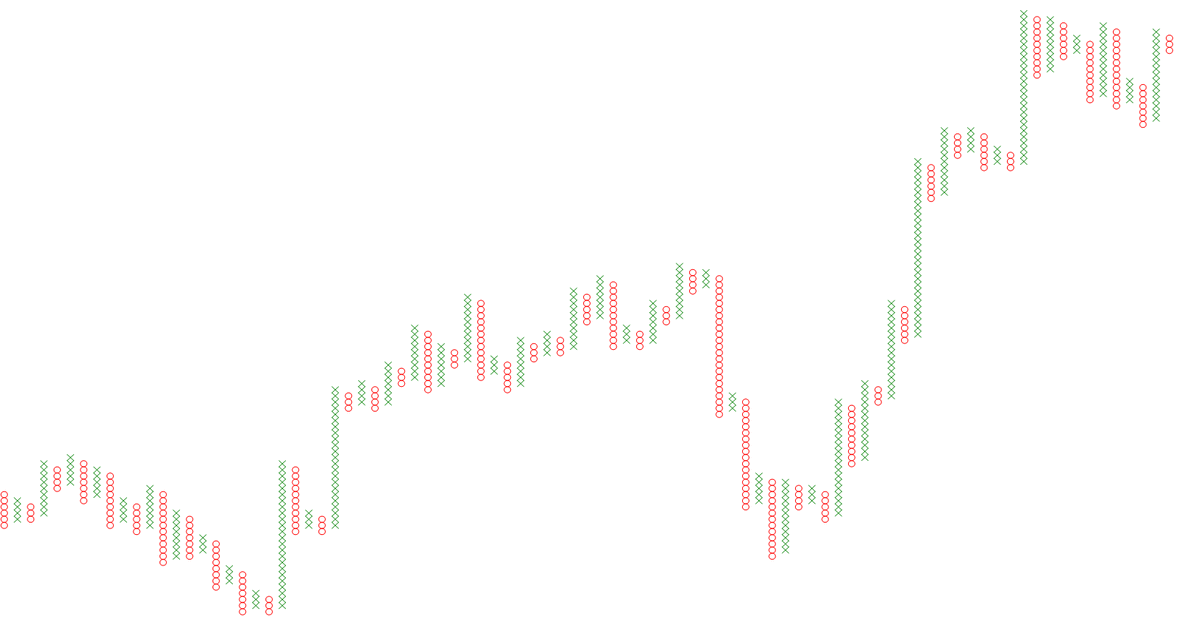
1. The marked zone in 'Green' is Demand Zone for Nifty
2. Price has traded there for more time than expected near the Demand Zone
3. Price trading near the demand zone is a negative sign and may have weakened the zone

#Nifty #nifty50 #NIFTYFUT
1. View is Bullish until trading above Triple Moving Average
2. Currently trading near previous Swing High
#Niftybank #banknifty #BNF
Open Interest and FII Activity and Data analysis
#openinterest #OI #pcr #fii #dii #data
Summary of #premarketcapsule for 5th September, Monday
To get early (a day before) and complete access to the document, join the Telegram Channel at t.me/thenoiselesstr… or Join Technical Club at @StockEdgeSocial

Software Credit: @Definedge
Data Credit: @mystockedge
Community Credit: @StockEdgeSocial
@StockEdgeSocial @Definedge @mystockedge That's a wrap!

If you enjoyed this thread:

1. Follow me @kaushikaki for more of these
2. RT the tweet below to share this thread with your audience

• • •

Missing some Tweet in this thread? You can try to force a refresh
 

Keep Current with Prof Kaushik Akiwatkar

Prof Kaushik Akiwatkar Profile picture

Stay in touch and get notified when new unrolls are available from this author!

Read all threads

This Thread may be Removed Anytime!

PDF

Twitter may remove this content at anytime! Save it as PDF for later use!

Try unrolling a thread yourself!

how to unroll video
  1. Follow @ThreadReaderApp to mention us!

  2. From a Twitter thread mention us with a keyword "unroll"
@threadreaderapp unroll

Practice here first or read more on our help page!

More from @kaushikaki

Sep 6
Thread-1 | Introduction to P&F Charts

In this thread we will discuss: 🧵⬇️
1. What is a Point & Figure Charts (P&F)
2. Why consider P&F for trading and investing
3. Construction of P&F Charts
4. How P&F method of charting will help you

1/33 Image
What is a P&F?
P&F chart plots price movements for stocks, bonds, commodities, or futures without taking into consideration the passage of time. Contrary to some other types of charts like OHLC, which mark the degree of an asset's movement over set time periods

2/33 Image
P&F Charts consist of columns of X's and O's that represent filtered price movements. X-Columns represent rising prices and O-Columns represent falling prices.

3/33 Image
Read 34 tweets
Sep 6
#PreMarketCapsule | 6th September, Tuesday | Edition: 35

In the thread⬇️
1. #Nifty Range and Breadth
2. #Banknifty range and Breadth
3. #Sector Breadth
4. #FII Derivative Activity
5. #Summary of the analysis Image
1. Price trading above TMA is bullish
2. Broke out of recent consolidation
3. Near resistance is 18000
4. Support is 17500
#Nifty #nifty50 #NIFTYFUT Image
Read 11 tweets
Jul 16
Breadth Indicator

The most relevant indicator to understand and evaluate market sentiment

In this thread:
1. What is a breadth indicator
2. Different types
3. How to use it

Concept Thread 🧵⬇️
Breadth helps to evaluate the market sentiments by measuring the number of stocks above and below particular criteria.

2/49
When a trend is strong: most of the stocks are moving with it, and new trades in the direction of the trend may not prove to be profitable or affordable from SL standpoint many a time.

3/49
Read 50 tweets
Jul 15
Pre-Market Capsule | 15th July

In the thread ⬇️
1. #Nifty Range for the day
2. Nifty Breadth
3. #Banknifty range for the day
4. Banknifty Breadth
5. #Sector Breadth
6. #Derivative Analytics
7. Summary
1/10
#Nifty on charts

1. Nifty below TMA is bearish
2. Currently near the support zone
3. If Nifty goes below 15860 it will increase the chances of reaching 16670 levels or further below

2/10
Nifty Breadth is cooling off which is a good sign for the markets

3/10
Read 11 tweets
Jul 14
Pre-Market Capsule | 14th July

In the thread ⬇️
1. #Nifty Range for the day
2. Nifty Breadth
3. #Banknifty range for the day
4. Banknifty Breadth
5. #Sector Breadth
6. #Derivative Analytics
7. Summary Image
#Nifty on charts

1. Trading below TMA
2. TMAs are turning negative
3. When TMAs are in the process of becoming negative = #markets generally go sideways
4. Expect sideways to #bearish action Image
Nifty Breadth = Overbought
74% Image
Read 12 tweets
May 29
1/12
Did you try predicting momentum in stock but failed? This thread is for you.

In this tread, we will discuss the concept of Momentum Trading using Relative Strength to identify a perfect trade setup which will have high accuracy and small SL.

Strategy Thread 🧵⬇️
2/12

Relative Strength is a behaviour of stock w.r.t Benchmark or Sector. That means it is a method of identifying stocks or instruments that are relatively strong or weak either against benchmark or sector.
3/12
If you are following me for some time now, you know what is momentum.

If not, check out my Twitter Thread on RSI
Read 12 tweets

Did Thread Reader help you today?

Support us! We are indie developers!


This site is made by just two indie developers on a laptop doing marketing, support and development! Read more about the story.

Become a Premium Member ($3/month or $30/year) and get exclusive features!

Become Premium

Don't want to be a Premium member but still want to support us?

Make a small donation by buying us coffee ($5) or help with server cost ($10)

Donate via Paypal

Or Donate anonymously using crypto!

Ethereum

0xfe58350B80634f60Fa6Dc149a72b4DFbc17D341E copy

Bitcoin

3ATGMxNzCUFzxpMCHL5sWSt4DVtS8UqXpi copy

Thank you for your support!

Follow Us on Twitter!

:(