#PreMarketCapsule | 6th September, Tuesday | Edition: 35
In the thread⬇️
1. #Nifty Range and Breadth
2. #Banknifty range and Breadth
3. #Sector Breadth
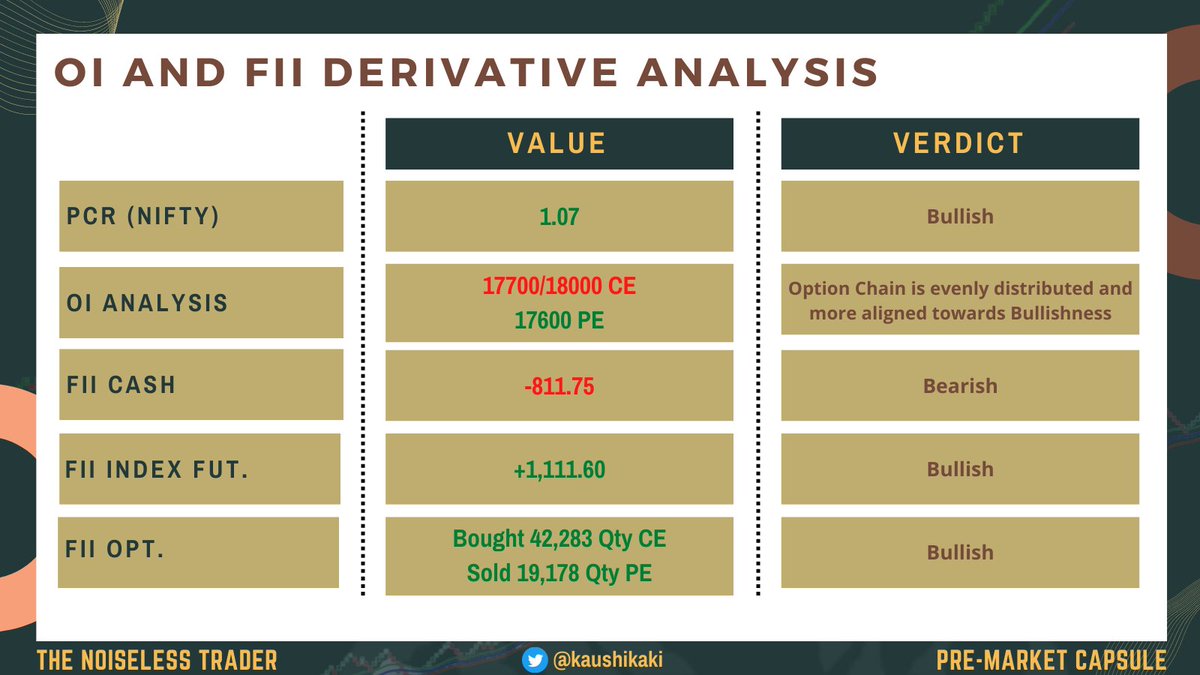
4. #FII Derivative Activity
5. #Summary of the analysis
In the thread⬇️
1. #Nifty Range and Breadth
2. #Banknifty range and Breadth
3. #Sector Breadth
4. #FII Derivative Activity
5. #Summary of the analysis

1. Price trading above TMA is bullish
2. Broke out of recent consolidation
3. Near resistance is 18000
4. Support is 17500
#Nifty #nifty50 #NIFTYFUT
2. Broke out of recent consolidation
3. Near resistance is 18000
4. Support is 17500
#Nifty #nifty50 #NIFTYFUT

1. View is Bullish until trading above Triple Moving Average
2. Price trading above 39780 is Bullish
3. Dynamic Support is at 39650, 39600, and 39550
4. Price may take pullback till TMA. It should be considered a healthy sign.
#Niftybank #banknifty #BNF
2. Price trading above 39780 is Bullish
3. Dynamic Support is at 39650, 39600, and 39550
4. Price may take pullback till TMA. It should be considered a healthy sign.
#Niftybank #banknifty #BNF

#Sector #Analysis
#Auto #Bank #Financial Services #FMCG #Healthcare #IT #Media #Metal #Pharma #PrivateBank #PSUBank #Realty #ConsumerDurables #OilandGas
#Auto #Bank #Financial Services #FMCG #Healthcare #IT #Media #Metal #Pharma #PrivateBank #PSUBank #Realty #ConsumerDurables #OilandGas

Summary of #premarketcapsule for 6th September, Tuesday 

To get early (a day before) and complete access to the document, join the Telegram Channel at t.me/thenoiselesstr…… or Join Technical Club at @StockEdgeSocial
Software Credit: @Definedge
Data Credit: @mystockedge
Community Credit: @StockEdgeSocial
Software Credit: @Definedge
Data Credit: @mystockedge
Community Credit: @StockEdgeSocial
From tomorrow #PreMarketCapsule will be posted exclusively on Telegram Channel (t.me/thenoiselesstr…)
That's a wrap!
If you enjoyed this thread:
1. Follow me @kaushikaki for more of these
2. RT the tweet below to share this thread with your audience
If you enjoyed this thread:
1. Follow me @kaushikaki for more of these
2. RT the tweet below to share this thread with your audience
https://twitter.com/132521347/status/1566969476406562816
• • •
Missing some Tweet in this thread? You can try to
force a refresh


