#QNT Medium term outlook from a technical perspective:
A chart thread 🧵
#cryptocurrency #Cryptos #altcoins #Quant $QNT #QNT #CryptoNews #Crypto
1/9
A chart thread 🧵
#cryptocurrency #Cryptos #altcoins #Quant $QNT #QNT #CryptoNews #Crypto
1/9
We all know how promising #QNT is from a fundamental perspective. In this thread I want to explore #Quant from a TA POV both bullish and bearish medium term scenarios
👇
2/9
👇
2/9
Bullish Scenarios-
The chart below displays #Qnt's impressive bullish momentum:
- Price above 50d, 100d and 200d ema (not many alts can say this!)
- Crucially, the 50d is above the 100d which is above the 200d. This formation is seen in bull markets such as 2020/21
3/9
The chart below displays #Qnt's impressive bullish momentum:
- Price above 50d, 100d and 200d ema (not many alts can say this!)
- Crucially, the 50d is above the 100d which is above the 200d. This formation is seen in bull markets such as 2020/21
3/9

On the weekly I like to use the 8w, 21w and 50w ema:
- Price is holding the 8 and 21 ema as support but 50w acting as a resistance
- 8w ema has crossed the 21w (bullish) but....
- Bulls need to see the 8 above the 21 above the 50 as per 2020 to be full momentum bull
4/9
- Price is holding the 8 and 21 ema as support but 50w acting as a resistance
- 8w ema has crossed the 21w (bullish) but....
- Bulls need to see the 8 above the 21 above the 50 as per 2020 to be full momentum bull
4/9

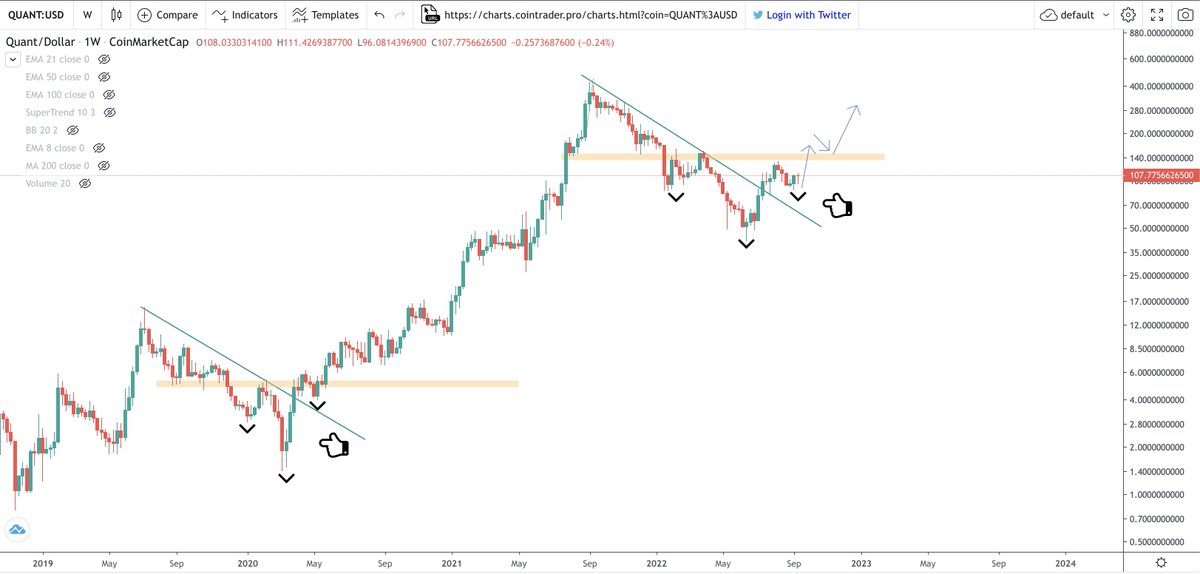
#QNT Weekly horizontal/diagonal resistance and pattern:
- Bullish break of the diagonal bear market trend line
- Major horizontal resistance (orange box) above
- Inverse head and shoulders in play
- All above points rhyme with the start of the 2020 bull
5/9
- Bullish break of the diagonal bear market trend line
- Major horizontal resistance (orange box) above
- Inverse head and shoulders in play
- All above points rhyme with the start of the 2020 bull
5/9

#QNT / #BTC :
- All major resistance taken out apart from ATH
- Price above 0.618 fib
- Lovely bullish weekly ema formation, price bouncing off 8 ema showing strength
- Looking good as long as 618 and emas hold as support and maintain formation (8 above 21 above 50)
6/9
- All major resistance taken out apart from ATH
- Price above 0.618 fib
- Lovely bullish weekly ema formation, price bouncing off 8 ema showing strength
- Looking good as long as 618 and emas hold as support and maintain formation (8 above 21 above 50)
6/9

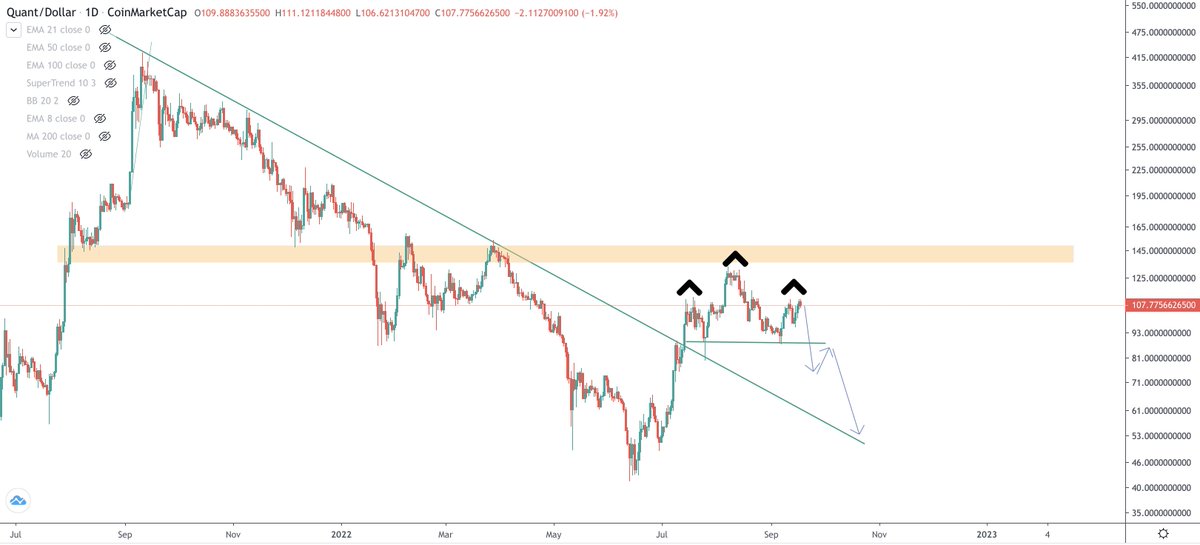
Bearish Daily scenario:
- Price possibly forming bearish head and shoulders below key weekly resistance (orange box)
- If this played out price would likely fall back to retest the bear market diagonal trend line
- If the trend line holds and price forms a higher low ...
7/9
- Price possibly forming bearish head and shoulders below key weekly resistance (orange box)
- If this played out price would likely fall back to retest the bear market diagonal trend line
- If the trend line holds and price forms a higher low ...
7/9

... although short term bearish, this could still be interpreted as bullish from a medium term perspective.
Bullish momentum buyers may look to add to positions if price retests the key daily and weekly emas shown in the earlier charts but should be weary of the daily h+s
8/9
Bullish momentum buyers may look to add to positions if price retests the key daily and weekly emas shown in the earlier charts but should be weary of the daily h+s
8/9
I hope you find these charts useful and informative.
Please like, share, comment and follow for more #crypto insights.
9/9
Please like, share, comment and follow for more #crypto insights.
9/9
@DonQ03 @QuantNetworkDev @eternalbroccoli
@DLTDonatello @3LionsMedia @MrMellow_Yellow @amphipod_crypto @Kevin_Cage_ @MurghSi @Miss_Andiswa @safakvakti1507 @BKNUGS @Filex56138007 @MacroView02 @CryptoOMC @joebtoucheskids @QIANG54028755 @RuskinXrp @NEenoghe @yiorikas @milg_777
@DLTDonatello @3LionsMedia @MrMellow_Yellow @amphipod_crypto @Kevin_Cage_ @MurghSi @Miss_Andiswa @safakvakti1507 @BKNUGS @Filex56138007 @MacroView02 @CryptoOMC @joebtoucheskids @QIANG54028755 @RuskinXrp @NEenoghe @yiorikas @milg_777
@AndyD25611160 @mightbeRICH @GlennSear @navulor @ezystayunderdog @aromazchibby @AndrewS19334284 @Pjet11 @gangcalls @DaanvanderStee2 @Heart_Of_Aces @Dimgor3 @Nonamesareleft2 @Mittap23 @Otasan888 @deity_digital @TerryBarnhart73 @Wirepuller555
• • •
Missing some Tweet in this thread? You can try to
force a refresh


