Tips to Choose the Right Intraday Trading Stocks:
THREAD 🧵 with @Stocktwit_IN @valuelevels
Liquid Stocks
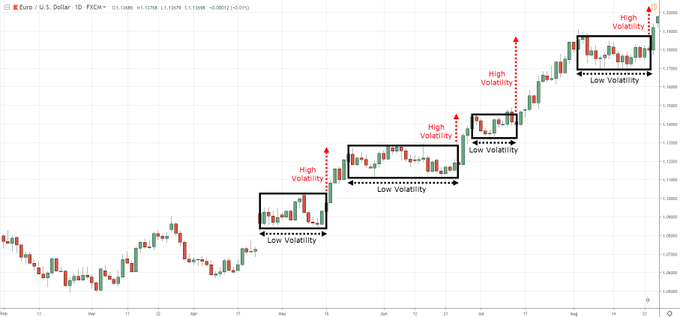
Volatile Stocks
Correlation Stocks
Right Stock
Trade after Research
#trading #investing #invest #StockMarket #StocksToTrade #Nifty #sensex #banknifty #TechnicalTrades
THREAD 🧵 with @Stocktwit_IN @valuelevels
Liquid Stocks
Volatile Stocks
Correlation Stocks
Right Stock
Trade after Research
#trading #investing #invest #StockMarket #StocksToTrade #Nifty #sensex #banknifty #TechnicalTrades

Liquidity is the most important intraday trading tip while choosing the right stocks to trade during the day. Liquid stocks have huge trading volumes whereby larger quantities can be purchased and sold without significantly affecting the price. Don’t forget to check... 

liquidity at various price levels. You will find some stocks that are highly liquid at a lower price level, but the volume drops drastically after reaching a certain price zone. Variability of liquidity at different price levels will help you buy these stocks at the right time.
It is commonly noticed that a low daily volume of traded stocks or those where some huge news is expected to move in an unpredictable way. Sometimes, the stock may show volatility even after the announcement of the big news. Traders are recommended to avoid intraday trading in.. 

such stocks. A few volatile stocks are in the mid-size segment while most stocks traded in the low-cap categories like S, T, and Z are highly chaotic. In addition to being volatile, these stocks have low daily volumes, making them illiquid.
An intraday tip for choosing the right stock is to opt for those that have a higher correlation with major sectors and indices. This means when the indexsector sees an upward movement, the stock price also increases. Stocks that move according to the sentiment of the group are... 

reliable and often follow the expected movement of the sector. For ex, strength of the IN₹ against the $ will generally affect all IT co. dependent on the US mkt. A stronger ₹ implies lower earnings for the IT co. &weakening ₹ will result in higher export incomes for these co.
1 of the most imp intraday trading tips is to remember that moving with the trend is always beneficial. During a bull run in the stk mkt, traders must try to identify stks that can potentially arise. On the other hand, during the bear run, finding stks that are likely to decline. 

Undertaking quality research is one of the most vital intraday tips that traders must always remember. Unfortunately, most day traders avoid doing their research. Identifying the index and then finding sectors that are of interest is recommended. The next step is to create... 

a list of several stocks with these sectors. Traders need not necessarily include sector leaders, but rather identify stocks that are liquid. Technical analysis and determining the support and resistance levels along with studying the fundamentals of these stocks will help...
traders find the right stocks to profit through intraday/day trading. The most important step for an intraday trader is selecting the stocks to trade intraday. You need stocks that can give movement and at the same time are predictable. 

Learn more & get Experts trading ideas with AngelOne
tinyurl.com/vobqkuw
#trading
#TradingView
#tradingpsychology
#TradingSignals
#nifty50 #BANKNIFTY
tinyurl.com/vobqkuw
#trading
#TradingView
#tradingpsychology
#TradingSignals
#nifty50 #BANKNIFTY
@tradersreport
@NaredraSingh141
@KumarShahansh
@doc_srishti
@SatKabi12559041
@Rishikesh_ADX
@AnkurPatel59
@ankitkakkad11
@Arpit1223
@AdityaTodmal
@VCPSwing
@BrkoutGeek
@born_to_invest
@SUM_Dhamija
@Technicalchart1
@FCIBANG
@rattibha
@threadreaderapp
@UnrollHelper
@SaveToNotion
@NaredraSingh141
@KumarShahansh
@doc_srishti
@SatKabi12559041
@Rishikesh_ADX
@AnkurPatel59
@ankitkakkad11
@Arpit1223
@AdityaTodmal
@VCPSwing
@BrkoutGeek
@born_to_invest
@SUM_Dhamija
@Technicalchart1
@FCIBANG
@rattibha
@threadreaderapp
@UnrollHelper
@SaveToNotion
• • •
Missing some Tweet in this thread? You can try to
force a refresh


