I have stated all along, that constitutional challenges, trying to end the mandates, etc. - will NOT work UNTIL you take out the foundation!
Here are some facts to knock out the foundation (the "data" used to justify ALL measures, restrictions, mandates, etc.):
1/...🧵
Here are some facts to knock out the foundation (the "data" used to justify ALL measures, restrictions, mandates, etc.):
1/...🧵
https://twitter.com/rant_rn/status/1485340581463314435
1) In any research, data collection, statistical analysis, etc. - you always start FIRST with a definition of "who" you are studying.
That definition largely consists of definitive parameters of "inclusion" and "exclusion" criteria...
2/...🧵
That definition largely consists of definitive parameters of "inclusion" and "exclusion" criteria...
2/...🧵
...to insure the integrity of the data - & eliminate (or try to eliminate) confounding variables, etc.
If you get your inclusion criteria (aka "case definition" for COVID-19) wrong, then ALL of your data is corrupted & completely useless.
"Garbage in, garbage out" #GIGO
3/...
If you get your inclusion criteria (aka "case definition" for COVID-19) wrong, then ALL of your data is corrupted & completely useless.
"Garbage in, garbage out" #GIGO
3/...
With COVID-19 however, it is quite clear that the government was FULLY aware of (what was closest to) the true & relevant data - yet INTENTIONALLY only disclosed the corrupted data.
When dealing with infectious diseases (i.e. Clinical Epidemiology) - what is most important...🧵
When dealing with infectious diseases (i.e. Clinical Epidemiology) - what is most important...🧵
...is that the data reflects the actual burden on society (i.e. healthcare) by the pathogen.
That is why, prior to the 2019-2020 respiratory season - a "case" (i.e. Influenza) was either someone ill enough to seek out the medical attention that resulted in testing - or...
5/...
That is why, prior to the 2019-2020 respiratory season - a "case" (i.e. Influenza) was either someone ill enough to seek out the medical attention that resulted in testing - or...
5/...
...were SYMPTOMATIC patients tested during a suspected outbreak in a nursing home.
Ontario was very quick to adopt the (baffling) new, unique & completely faulty "case definition" for COVID-19 that placed essentially no limits on "who" was being studied.
6/...🧵
Ontario was very quick to adopt the (baffling) new, unique & completely faulty "case definition" for COVID-19 that placed essentially no limits on "who" was being studied.
6/...🧵
This doomed all of the data from the very start.
The Gov't of Ontario's internal Public Health data tracked who was asymptomatic (the VAST majority), who was symptomatic but did not require any medical attention (based on another over-inclusive definition: of "symptomatic")...
The Gov't of Ontario's internal Public Health data tracked who was asymptomatic (the VAST majority), who was symptomatic but did not require any medical attention (based on another over-inclusive definition: of "symptomatic")...
...who was symptomatic & required various levels of medical attention. (Although even that was still corrupted & over-inflated.)
Their internal data also separated so-called "incidental" cases due to over-zealous mass testing from actual "cases" - for hospitalizations...
8/...
Their internal data also separated so-called "incidental" cases due to over-zealous mass testing from actual "cases" - for hospitalizations...
8/...
...ICU admissions, ventilated patients - AND deaths.
ALL of this data was tracked separately in their INTERNAL data from DAY 1.
However, the Government of Ontario KNOWINGLY and WILLINGLY only presented to corrupted total data to the legislators, decision makers...
9/...
ALL of this data was tracked separately in their INTERNAL data from DAY 1.
However, the Government of Ontario KNOWINGLY and WILLINGLY only presented to corrupted total data to the legislators, decision makers...
9/...
...educators, the media - AND the public.
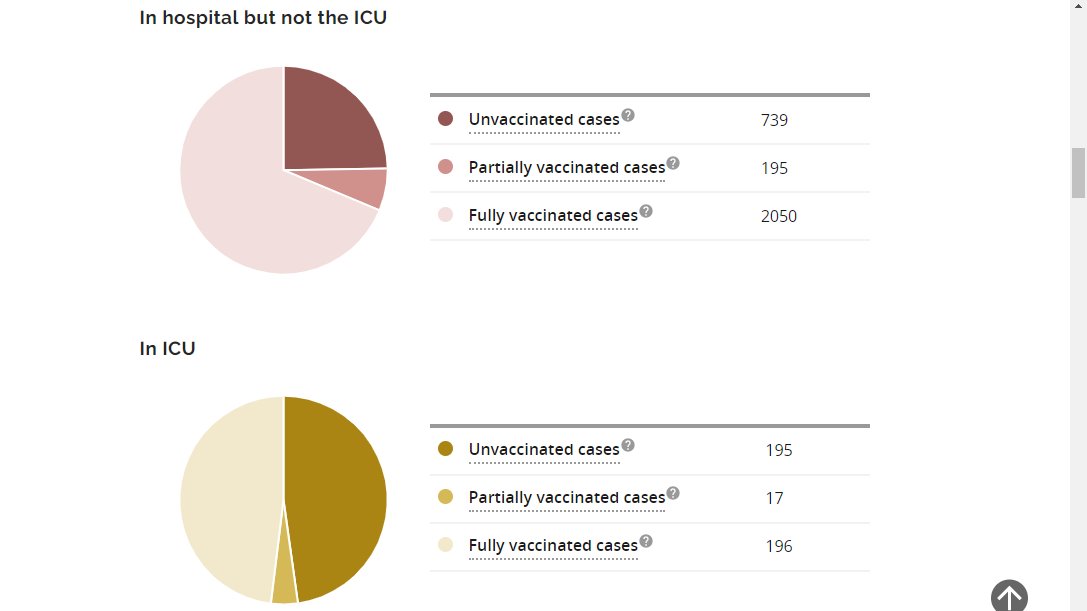
(They only PARTIALLY disclosed some of the data regarding "incidental" cases, once vaccinated patients made up the majority of hospitalized "cases".)
10/...
(They only PARTIALLY disclosed some of the data regarding "incidental" cases, once vaccinated patients made up the majority of hospitalized "cases".)
10/...
As Ontario is Canada's most populous province by a significant margin - Ontario's COVID-19 data also makes up the most significant portion of the national data on cases, hospitalizations, deaths, etc. - and this corrupted ALL of the national data.
11/...
11/...
Trudeau, Freeland, and Tam were no doubt aware of this...or completely incompetent....or both.
12/...🧵
12/...🧵
2) Further complicating the issue - beyond proper inclusion criteria - for data to be accurate (whether research, science, medicine or business) - you MUST record the findings, results, outcomes, etc. - in a manner that properly attributes the data to date to which it applies...
Whether reviewing research findings, clinical findings, etc. - when one finds or corrects data from past months, quarters, etc. - it would be both fraudulent & deceitful to just add that data to today's numbers, findings, etc.
14/...
14/...
It would NOT be a truthful or ACCURATE reflection of the ACTUAL situation.
Doing so has cost many people their reputations, tenure, funding, careers,...and often results in heavy fines and jail time!
Unfortunately, Ontario did just that with the COVID-19 data!
15/...
Doing so has cost many people their reputations, tenure, funding, careers,...and often results in heavy fines and jail time!
Unfortunately, Ontario did just that with the COVID-19 data!
15/...
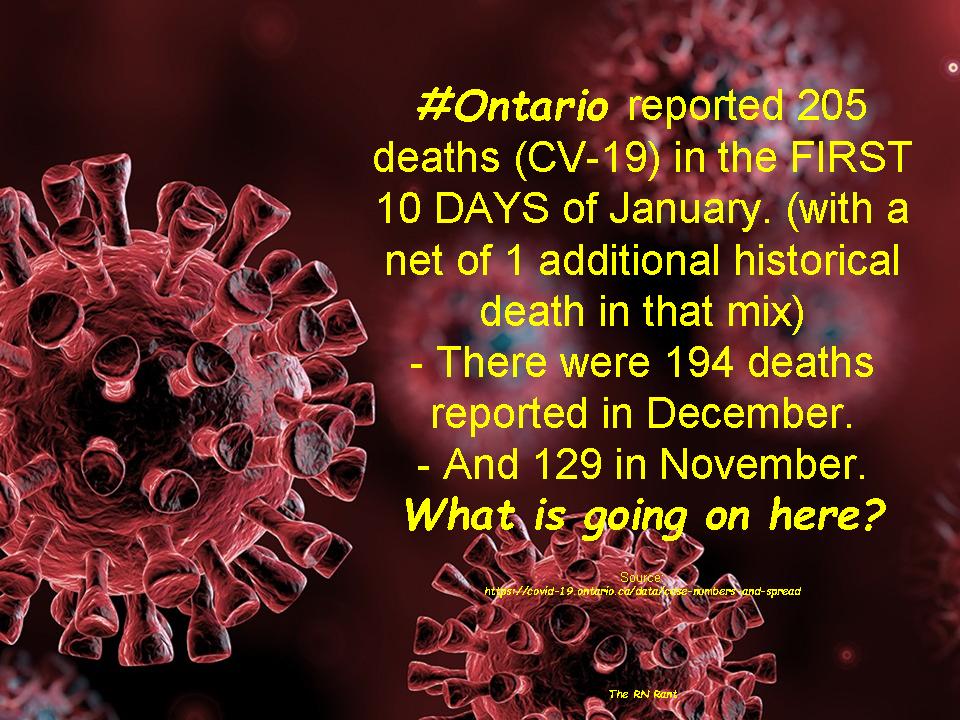
EVERY DAY, historical data (i.e. cases, deaths) was dumped into the current daily numbers.
They announced it ONLY when it is significant enough to be noticed - and justified it as "data cleanup" (aka data dump).
However, this has been happening EVERY DAY since 2020!
16/...
They announced it ONLY when it is significant enough to be noticed - and justified it as "data cleanup" (aka data dump).
However, this has been happening EVERY DAY since 2020!
16/...
3) Then consider the ridiculously high cycle-threshold (Ct) that Ontario labs were using to process PCRs.
At that high a level (usually 45) - the results CANNOT differentiate between the correct & intact virus, old/dead virus particles, artifact, etc.
17/...
At that high a level (usually 45) - the results CANNOT differentiate between the correct & intact virus, old/dead virus particles, artifact, etc.
17/...
It makes them extremely over-sensitive - but completely unreliable (and not specific to COVID-19),
Regardless, PCRs were NEVER intended to be a stand-alone diagnostic tool. They do NOT diagnose.
18/...
Regardless, PCRs were NEVER intended to be a stand-alone diagnostic tool. They do NOT diagnose.
18/...
Used correctly, they can aid in confirming a diagnosis and provide some level of clinical correlation in symptomatic patients.
19/...
19/...
4) Now consider what Ontario Premier Doug Ford and Minister of Health Christine Elliot were REALLY doing in their daily press conferences when they stated that they were imposing restrictions, lockdowns, shutdowns, mandates, etc. "BECAUSE OF THE NUMBERS".
20/...
20/...
"BECAUSE OF THE [fraudulent & fear-invoking] NUMBERS [that we are intentionally misleading and deceiving you with]"....
21/...
21/...
They then INTENTIONALLY used this corrupted data (despite knowing the mostly correct data) to state that their measures, lockdowns, shutdowns, mandates, etc. - were "reasonable limits prescribed by law as can be demonstrably justified in a free and democratic society."
22/...
22/...
KNOWINGLY and WILLFULLY using corrupted data - and presenting (and misrepresenting) it as an accurate reflection of the situation - crosses the legal threshold into fraudulent actions - which are then used to both restrict the rights of citizens AND...
23/...
23/...
...to increase their political powers - "by deceit, falsehood or other fraudulent means".
CONCLUSION:
If you can clearly demonstrate the above to the public AND the media AND the courts...this will be the game changer!
24/24
END of 🧵
CONCLUSION:
If you can clearly demonstrate the above to the public AND the media AND the courts...this will be the game changer!
24/24
END of 🧵
Would be interested to hear thoughts from:
@JCCFCanada @CDNConstFound @c2cjournal @MLInstitute @WSOnlineNews @forevaeva79 @rpoconnor @LDBildy @dockaurG @LionAdvocacy @erdocAA @PardyBruce @ryan_p_alford @cvangeyn @jobearon @DrJBhattacharya @SleepMD_zzz @DrPPhillipsMD @DrJ56013122
@JCCFCanada @CDNConstFound @c2cjournal @MLInstitute @WSOnlineNews @forevaeva79 @rpoconnor @LDBildy @dockaurG @LionAdvocacy @erdocAA @PardyBruce @ryan_p_alford @cvangeyn @jobearon @DrJBhattacharya @SleepMD_zzz @DrPPhillipsMD @DrJ56013122
• • •
Missing some Tweet in this thread? You can try to
force a refresh


