Stoic Trader Profile picture
Jan 27, 2023 11 tweets 10 min read Read on X
BULL TRAP THESIS 🧐

Read this comprehensive thread so you understand why this is the BIGGEST BULL TRAP that we have ever seen

#thread 🧵 Image
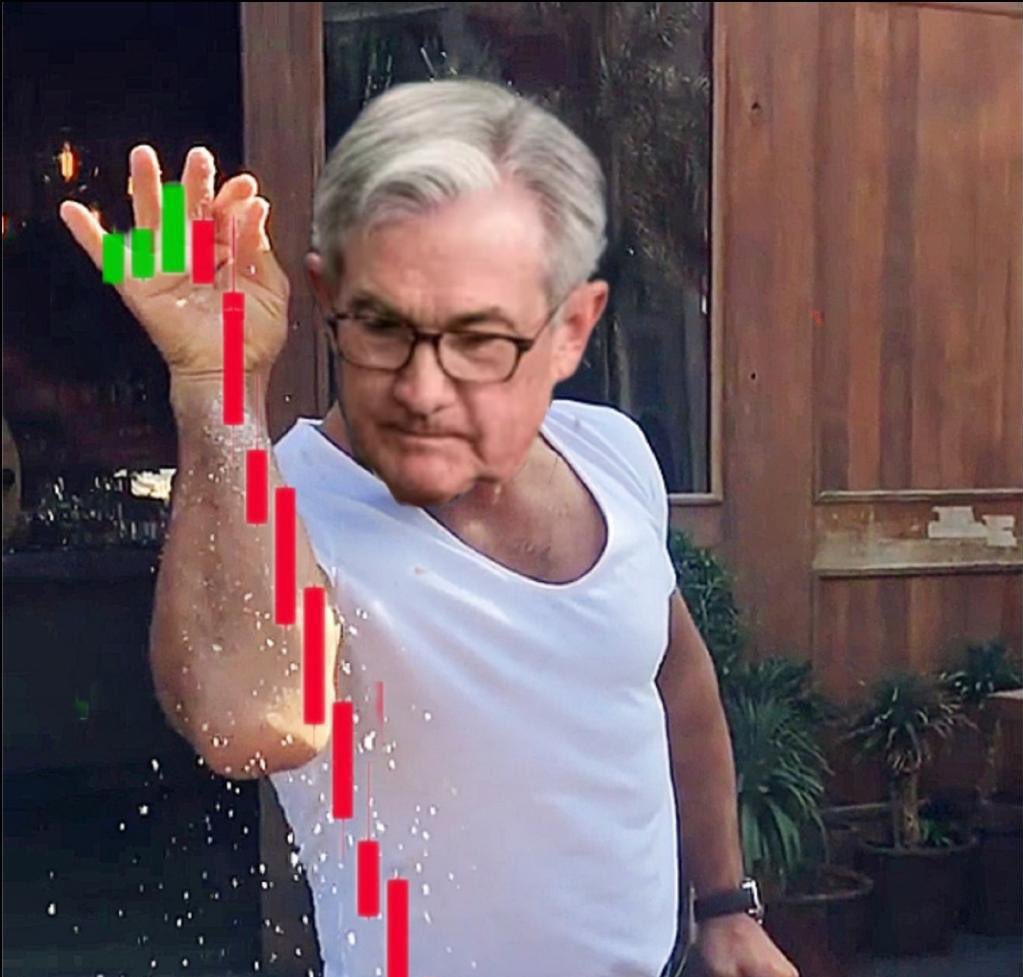
Let's start with JPOW & Interest Rates

Currently, Fed has been raising interest rates to battle inflation which puts downward pressure on the #StockMarket

So if Fed keeps raising rates, it's #bearish for #stocks & #crypto.

Raising Camign → Pause → Decreasing Campaign

2🧵 Image
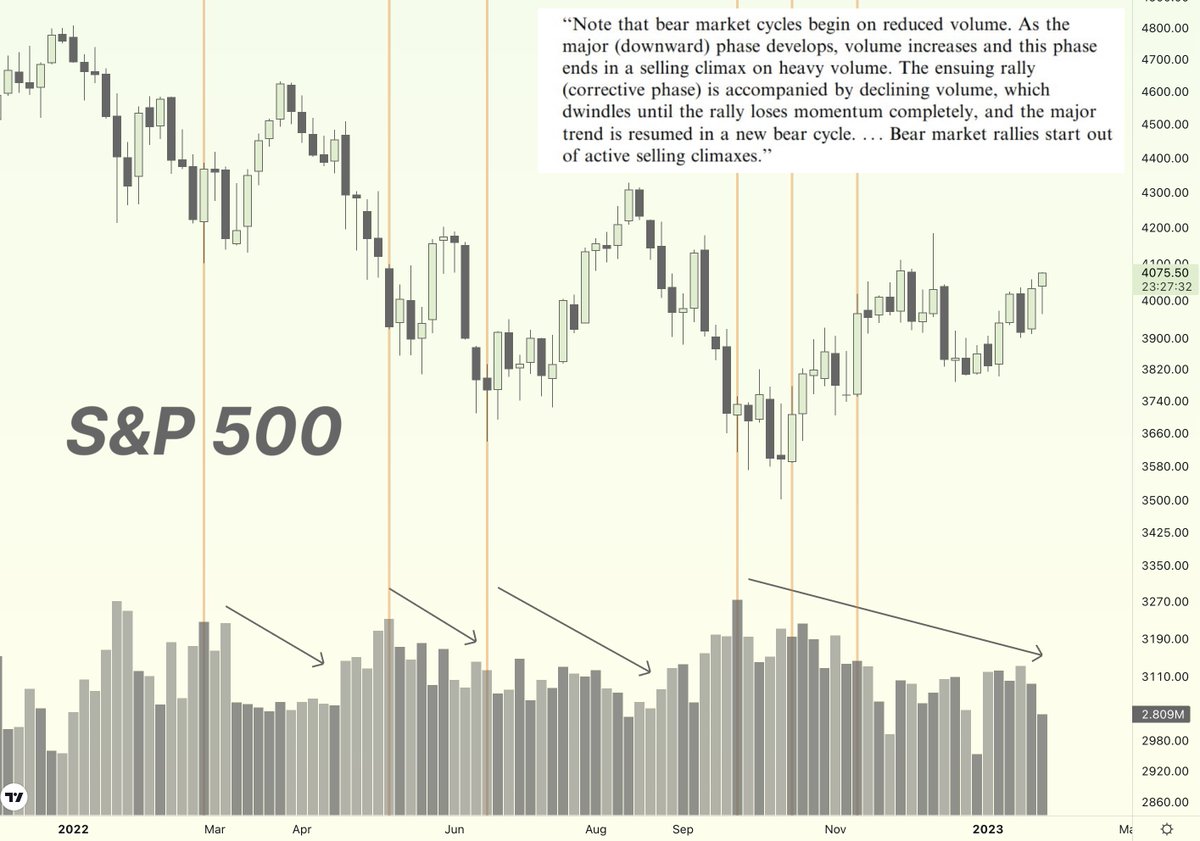
We are in a #BearMarket and this recent rally has sparked a lot of enthusiasm from #investors and #traders.

Bear Market Rallies are a common phenomenon during the Bear Market and usually have multiple selling climaxes and declining volume on the rallies.

3🧵 Image
Now, I am going to dive into different charts to show you the confluence of what I am saying.

First up, $VIX 👑

4🧵 Image
💡 Look for divergence when #VIX makes a lower low, #stocks should make a higher high and when it does not happen, we can anticipate a turn in the markets.

5🧵 Image
💡 Indicies Divergence

Monitor Three Major Indices: #DOW #NASDAQ #SPY and look for divergence, all three indices should follow each other and make higher highs and lower lows in tandem. When it does not happen, we can anticipate a turn in the markets.

6🧵 Image
💡 International #Bonds Divergence

Monitor International 10Y Bond Yields: #USA, #British, #German bonds and look for divergence.

Yield 📈 → Currency 📈 → Equities 📉

7🧵 Image
💡 #DXY Dollar Index at MAJOR support!

If the #Dollar bounces from its MID RANGE support, we could see a 6% rally which would be very #bearish for #stocks and #crypto.

8🧵 Image
#SP500 $ES_F $ES Technical Analysis

1. Liquidity Grab ✓
2. Displacement ✓
3. Structure Break ✓
4. Retracement ✓
5. Short inside Optimal Trade Entry ✓

9🧵 Image
This new bullish sentiment across #stocks and #crypto is getting out of control, intelligent 🧐 investors call it "Irrational Exuberance"

F&ck around...

10🧵
Enjoyed this #thread?

Like & Retweet the first tweet to spread the message 🙏

Follow @StoicTA for more #TRADINGTIPS and #SwingTrading

• • •

Missing some Tweet in this thread? You can try to force a refresh
 

Keep Current with Stoic Trader

Stoic Trader Profile picture

Stay in touch and get notified when new unrolls are available from this author!

Read all threads

This Thread may be Removed Anytime!

PDF

Twitter may remove this content at anytime! Save it as PDF for later use!

Try unrolling a thread yourself!

how to unroll video
  1. Follow @ThreadReaderApp to mention us!

  2. From a Twitter thread mention us with a keyword "unroll"
@threadreaderapp unroll

Practice here first or read more on our help page!

More from @StoicTA

Mar 27
The 61.8% retracement is my favorite level in trading.

It’s not magic.
It’s not luck.
It’s as close as we get to solving the market.

Here’s why it works and why I trust it more than any indicator 🧵👇 Image
1/ It’s a self-fulfilling prophecy.

Millions of traders watch it.
Banks watch it.
Algos watch it.

So when price pulls back to 61.8%, people act.

The level works not because it’s mystical but because the herd believes in it.
2/ It mirrors the rhythm of nature.

The golden ratio appears in seashells, galaxies, sunflowers.

Markets are no different.

61.8% is the sweet spot between chaos and control.

Deep enough to scare weak hands.
Precise enough to trap the herd.
Read 8 tweets
Mar 8
🚀 The most important POI you’re probably missing:

The Move Origin 🙌

It’s the launchpad for explosive moves, and it can make or break your trades.

Master it, and you’ll wonder how you ever traded without it 🧵👇
1/ 🎯 What is a Move Origin?

Simply put, it's the exact area on a high timeframe (HTF) chart where price started an aggressive, impulsive move.

Price frequently returns here to retest, creating powerful trade opportunities.
2/ 🔍 Identifying Unmitigated Move Origins:

- Spot sharp, impulsive moves on higher timeframes.
- Check if price revisited that origin yet.
- If untouched, mark it clearly, these unmitigated areas act as price magnets.
Read 11 tweets
Feb 10
STOP HUNTS MADE SIMPLE

You don’t need a fancy strategy to catch Turtle Soup setups.

All you need is liquidity + RSI Divergence to spot stop hunts and fade the fake move.

Here’s the simplest way to do it: 🧵👇 Image
1/ What is Turtle Soup?

It’s just a stop hunt reversal.

Market makers run stops above a key high (or below a key low) to trap breakout traders, then price reverses.

Your job? Wait for the trap and take the other side.
2/ Keep It Simple – The ONLY 3 Things You Need

1️⃣ Liquidity Grab – Price takes out a previous high/low
2️⃣ RSI Divergence – Momentum disagrees with price
3️⃣ Rejection Candle – Fast reversal from the stop hunt

That’s it. No indicators, no complex rules. Just watch price do its thing.
Read 9 tweets
Jan 20
Swing Breakout Sequence #SBS

It’s the most reliable setup I’ve ever taught.

This thread will show you:
- How it works
- Why it’s powerful
- How YOU can use it 🧵👇 Image
1/ What is SBS?

SBS is a price action sequence that happens after the breakout.

1. Breakout
2. First Tap
3. Quick Sclap
4. Return to Liquidate FT
5. Reversal Image
2/ How to trade SBS?

Wait for the price to liquidate First Tap and look for the Reversal with Target at the new high/low.

But wait there is more... Image
Read 10 tweets
Jan 19
🚨 WARNING: Most traders are trapped in slow-motion failure.

They grind for years, getting nowhere.

But the fastest path to mastery isn’t what you think.

Read on and uncover the secret: 👇🧵
1/ Forget the daily chart.

It’s a graveyard for learning.

Start where the action is: the 1min or even seconds chart.

It’s chaos - but chaos is the fastest teacher.
2/ Every second matters.

Trading 1-min charts crams years of experience into days.

Hesitate? You lose.
Learn? You adapt.

Fast pain = fast growth.
Read 11 tweets
Jan 5
🚨 WARNING: 99% of traders fail because they fall into a deadly trap.

Charts are full of bullish AND bearish setups at the same time.

Most traders can’t tell which ones will work…
And which ones will destroy their accounts.

Here’s the secret the pros use 👇🧵
1/ The market doesn’t care about your feelings, your predictions, or your hopes.

It only respects one thing: the TREND!

And the simplest way to uncover the trend?

The 20 SMA and 200 SMA.

These two lines are the key to filtering the noise.
2/ Here’s how it works (it’s almost TOO simple):

- If the price is above BOTH the 20 SMA & 200 SMA, the market is bullish. Take long setups. 📈

- If the price is below BOTH the 20 SMA & 200 SMA, the market is bearish. Take short setups. 📉

Ignore everything else. Period.
Read 12 tweets

Did Thread Reader help you today?

Support us! We are indie developers!


This site is made by just two indie developers on a laptop doing marketing, support and development! Read more about the story.

Become a Premium Member ($3/month or $30/year) and get exclusive features!

Become Premium

Don't want to be a Premium member but still want to support us?

Make a small donation by buying us coffee ($5) or help with server cost ($10)

Donate via Paypal

Or Donate anonymously using crypto!

Ethereum

0xfe58350B80634f60Fa6Dc149a72b4DFbc17D341E copy

Bitcoin

3ATGMxNzCUFzxpMCHL5sWSt4DVtS8UqXpi copy

Thank you for your support!

Follow Us!

:(