1. Over the last week, assets rallied in unison. Below, we show stocks, commodities, and bonds were up while the dollar sold off.
2. The strength of the moves in commodities has filtered through to the one-month pricing of rising growth outcomes. We show our market regime measures below.
3. While near-term pricing has been of rising growth, the distribution of regime probabilities remains flat, as highlighted above. Our non-linear trend process has worked well in navigating these conflicting market regime dynamics.
4. The weekly signal output from this process are shared below.
5. The shift in trend signal for Treasuries is particularly important, especially given that the market continues to price interest rate cuts. These look unlikely to materialize.
6. For further context, we recommend all our followers to read our latest edition of the Month in Macro ~ 45 pages of the best #macro content out there.
1. Recently we examined the latest data on US #government spending, i..e, US #fiscal impulse. Monthly spending data from the government contains significant #volatility; therefore, we apply a smoothing process to extract spending trends in government data.
2. Above, we show our estimates of the monthly changes in US government spending. We decompose this spending into its sources, i.e., government revenues, borrowing, and cash balances.
3. Our latest estimates for government spending in May saw spending rise by 1%, primarily driven by decreases in government cash balances.
Missed out anything from a week full of #Macro & #Markets? Don't worry - we got you covered.
Below we share all the updates & opinions threads from last week. Make sure to follow @prometheusmacro for much more.
1. We started the week by sharing updates on the latest #construction data. Overall, we noted that residential construction spending improved recently, that also flowed into our GDP Nowcast and real GDP estimate.
1. Nominal #GDP slowed through April, with real GDP contracting by -0.47% and #inflation rising by 0.23%. #Nominal GDP has grown approximately 4.7% from one year prior, continuing the downtrend beginning in February 2022.
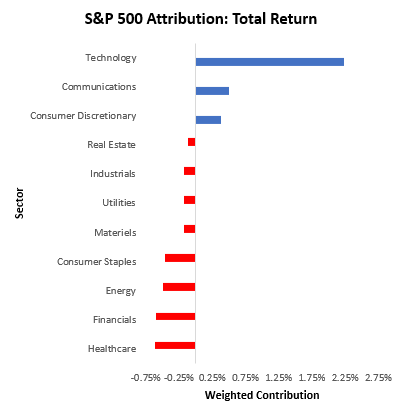
2. During this time, #equity markets have posed significant strength (though lopsided), while #treasury markets have weakened in unison.
3. Looking forward, these sequential improvements have adjusted our #real growth outlook, with a #contraction in yearly real GDP growth more likely in H1 2024 than in Q4 2023. Our #inflation outlook remains one of resilient inflation.
1. Recently, we received new PMI data, which feeds into our PMI composite, whose readings continue to show a weak environment for growth assets (stocks, commodities, & high yield credit). As of the latest available data, our PMI composite now shows a reading of -10.93.
2. This was a sequential deceleration from one month prior and a decline in the three-month trend. PMIs are generally strong directional indicators of where we are in the profit cycle, as PMI respondents manage inventories and orders in response to their outlook on profitability.
3. PMI indicators are typically biased toward the manufacturing sector. While this does indeed make sense since production is largely driven by the manufacturing sector, it is important to also separate these sub-indexes to understand the pervasiveness of the current trend .
1. Assets rebounded this week, with stocks, bonds, and gold all up on the week. Commodities showed mixed performance, with significant losses during the start of the week weighing on performance.
2. Recent #treasury strength continued the recent chop in the market, i.e., moving counter to the recent one-month trend. Below, we show the composition of total treasury market returns over the last month:
3. As we can see above, treasuries across the curve continue to show weakness as nominal #GDP continues to show resilience. At the same time, #equity markets continue to show lopsided performance over the past month, primarily driven by valuations rising: