Price moved right back into the sideways zone as mentioned above. Bear still in play and let's see how far we go.
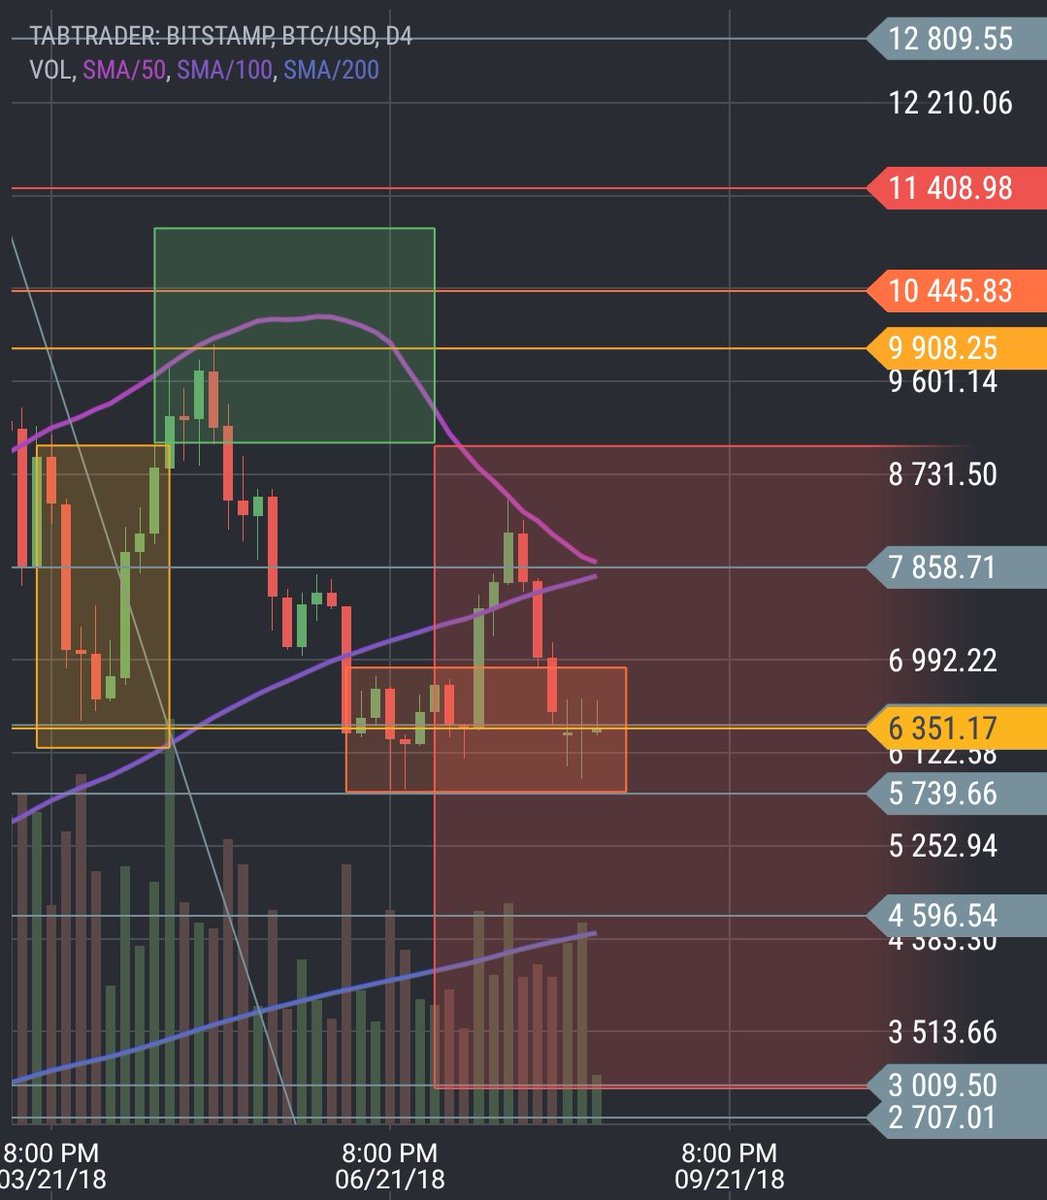
Another drop to ride the 100 SMA at around ~$5K for a short while and then a further drop to the 200 SMA to catch ~$3K.
Could take weeks/months to play out. ⏳
Another drop to ride the 100 SMA at around ~$5K for a short while and then a further drop to the 200 SMA to catch ~$3K.
Could take weeks/months to play out. ⏳


$BTC seems to be faking everyone out yet again with an extremely brief #altseason.
We're still ranging within the previously mentioned zone and should expect a start of the breakdown within 1-2 weeks.
Once we finally break $5800, I'm looking at ~$4600 for the next temp support.
We're still ranging within the previously mentioned zone and should expect a start of the breakdown within 1-2 weeks.
Once we finally break $5800, I'm looking at ~$4600 for the next temp support.
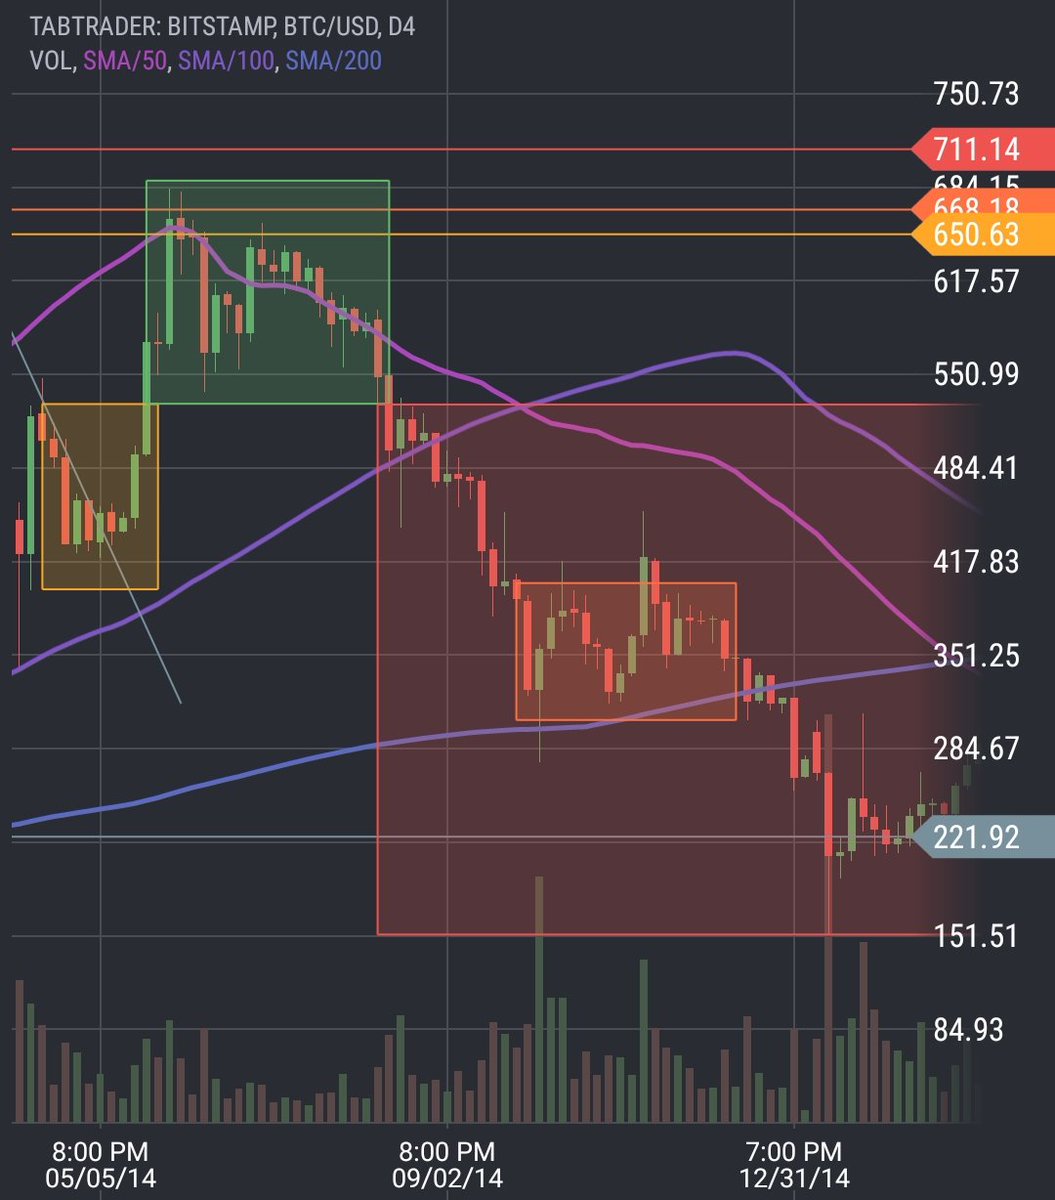
In 2014 the start of the $BTC dump from the flat range started Dec 31 and finally capitulated on Jan 13.
We now see a similar situation playing out although we ranged for 5 months vs 3 months in 2014.
Targets haven't changed. Approx. $3K with a possible wick to $2.7K.
We now see a similar situation playing out although we ranged for 5 months vs 3 months in 2014.
Targets haven't changed. Approx. $3K with a possible wick to $2.7K.


Something else I'm watching on the 2W $BTC chart. Using the AWO indicator we see that the first buy signal after the 2014 crash didn't trigger until March 1, 2015.
We're definitely not there yet...
We're definitely not there yet...


In the last week we've experienced a similar sell off like in 2015. It resulted in a sharp bounce and mini rally pushing price back up nearly 20% before the beginning of the final capitulation days later.
If we have a similar bounce it would put us at ~$4850 before the next...📉
If we have a similar bounce it would put us at ~$4850 before the next...📉


Haven't updated my $BTC cycle comparison in a while. Just wanted to give a quick update of where we're at. $2700-3000 target still in play but could potentially go lower to $1800 region. Let's see what happens in the coming weeks/months. 🤔


Funny, it's now been 1 year since my original post and I'm having the same feelings as last time. Everyone is ultra bullish rn & I feel like this is a massive bull trap. We nearly hit my original target, but I think we grind even lower. $2700-1800 imo. We'll see what happens.


In light of the unnatural push we're seeing on $BTC, this is how I see things playing out over the long term. This is an attempt to trap new buyers thinking we're going to new ATHs. The more they do this, the worse it'll be for recovery.
Get comfortable, this will take a while.
Get comfortable, this will take a while.

We're now approaching the first short-term bullish $9.8K target.
Another $BTC push up through $10K to find a rejection at ~$11.6K and then staircase down? 🤔🧐
Another $BTC push up through $10K to find a rejection at ~$11.6K and then staircase down? 🤔🧐

Not being a blind bear since we've seen that markets can stay irrational longer than expected. Ready for the possibility of a similar scenario as this.
We'll have to see how price reacts in the:
$6800 (100 W SMA)
$6200 level on the trendline
$5600-5800 (50 W SMA + 21 M EMA)
We'll have to see how price reacts in the:
$6800 (100 W SMA)
$6200 level on the trendline
$5600-5800 (50 W SMA + 21 M EMA)


$BTC overshot my original $11.6K target and wicked right into my next $13.8K one. This might be it, but not holding my breath.
Possible fractal of how things may play out. Sideways movement, alts breakout, everything seems OK just like in early-to-mid January 2018.
Then... 📉
Possible fractal of how things may play out. Sideways movement, alts breakout, everything seems OK just like in early-to-mid January 2018.
Then... 📉


My potential long-term $BTC game plan.
People are underestimating the effects that Tether will have on the space if the Bitfinex trial moves forward.
Everyone is banking on the halvening as the fundamental saving grace.
BTC tends to behave inversely to what the crowd expects.
People are underestimating the effects that Tether will have on the space if the Bitfinex trial moves forward.
Everyone is banking on the halvening as the fundamental saving grace.
BTC tends to behave inversely to what the crowd expects.

*yawn* $BTC

Feeling slightly short-term bullish on $BTC if this trendline continues to hold before the next draw down. 🧐

Holding my $BTC long with SL in profit, but was looking earlier today and I'm not feeling overly convinced.
This looks like a weak break and will ultimately break down to the $7575-7275 range.
Everyone's feeling very confident about the $8500 bounce but not seeing it, imo.
This looks like a weak break and will ultimately break down to the $7575-7275 range.
Everyone's feeling very confident about the $8500 bounce but not seeing it, imo.

$BTC has been riding this long-term trendline for a while now.
Can't see this holding for much longer than a few more days possibly.
We might get the breakdown sooner than I originally expected.
Still short from $10.9K 📉
Can't see this holding for much longer than a few more days possibly.
We might get the breakdown sooner than I originally expected.
Still short from $10.9K 📉


Even sooner than that, apparently.

Guess who's back, back again...at the long-term trendline.

$BTC still on track moving sideways as suspected since late June. Currently rejecting and respecting the long term trends nicely.

$BTC finally out of the sideways range (orange block) although it looks like I was off by a few weeks. 🤷♂️
I was looking for the long-term trendline to finally break, followed by the ~$9800 support. So far so good. 👌
Looking for $8200 to break for a next stop to ~$7500-6800. 🤞
I was looking for the long-term trendline to finally break, followed by the ~$9800 support. So far so good. 👌
Looking for $8200 to break for a next stop to ~$7500-6800. 🤞

I updated my long-term $BTC chart to readjust the blocks based on current price action.
Notice the similarities between the 2014 bear market rally and now. 🧐
Notice the similarities between the 2014 bear market rally and now. 🧐

Those green support levels seemed so far away and completely out of reach for the $BTC bulls months ago. 🤷♂️