We tried, but couldn’t find the combined ERC-20 market cap ANYWHERE.
So we built one. From scratch. And we learned some new things about ETH: (thread)
To calculate and graph the entire ERC-20 market cap over time, we crunched data from all ERC-20 projects currently in our database (app.santiment.net).
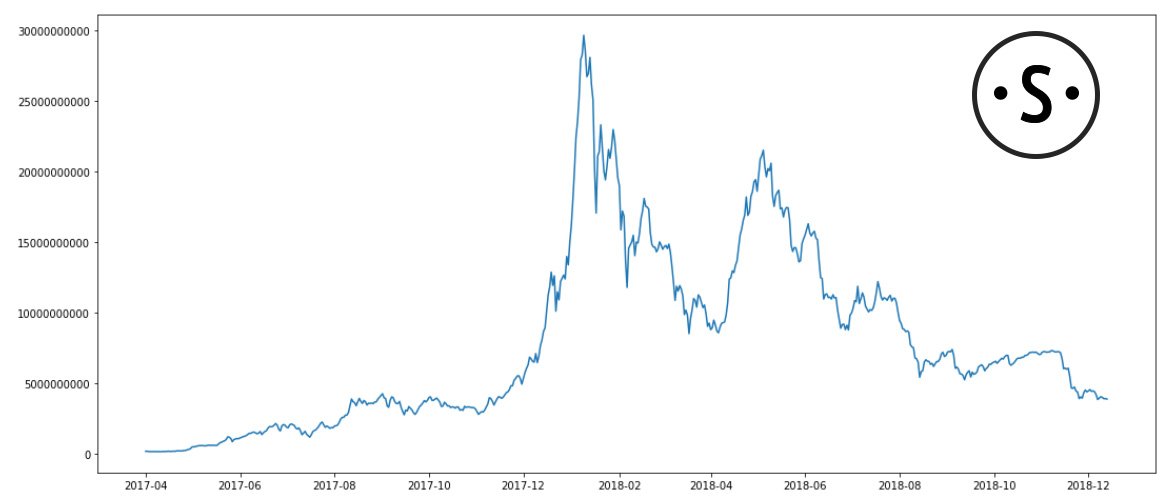
The result - our very own (and possibly first?) composite ERC-20 market cap, over time:

As expected, the ERC-20 market capitalization appears to move pretty similar to the ETH market cap (more on this in a moment).
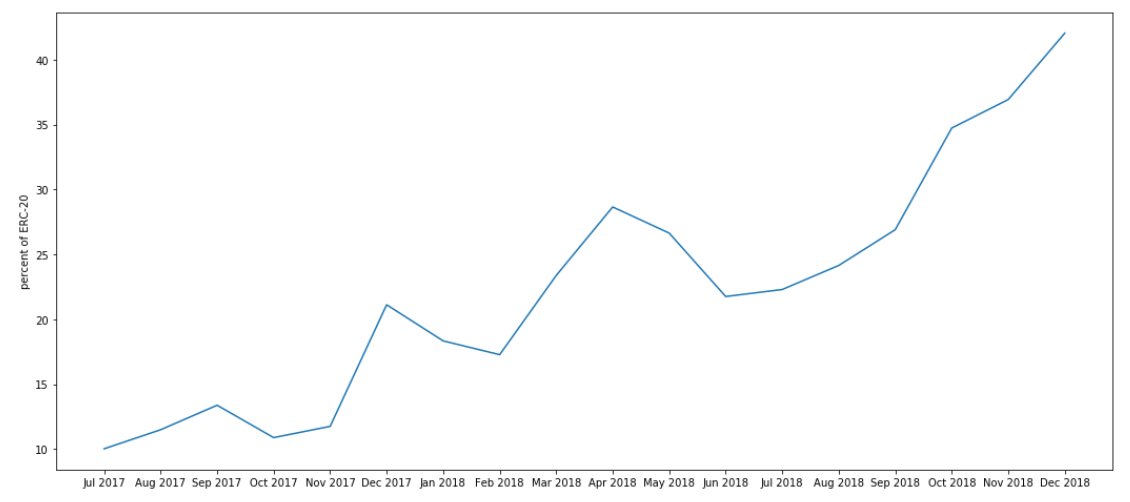
But another - more interesting trend - is also visible.
The reason for this, however, is *not* a gradual increase in the ERC-20 market cap.
Instead, it is because of a *progressive decline in the ETH market cap* - especially in the last 9 months.
So this growth is likely propelled by *new projects entering the market, rather than existing projects increasing in value.*
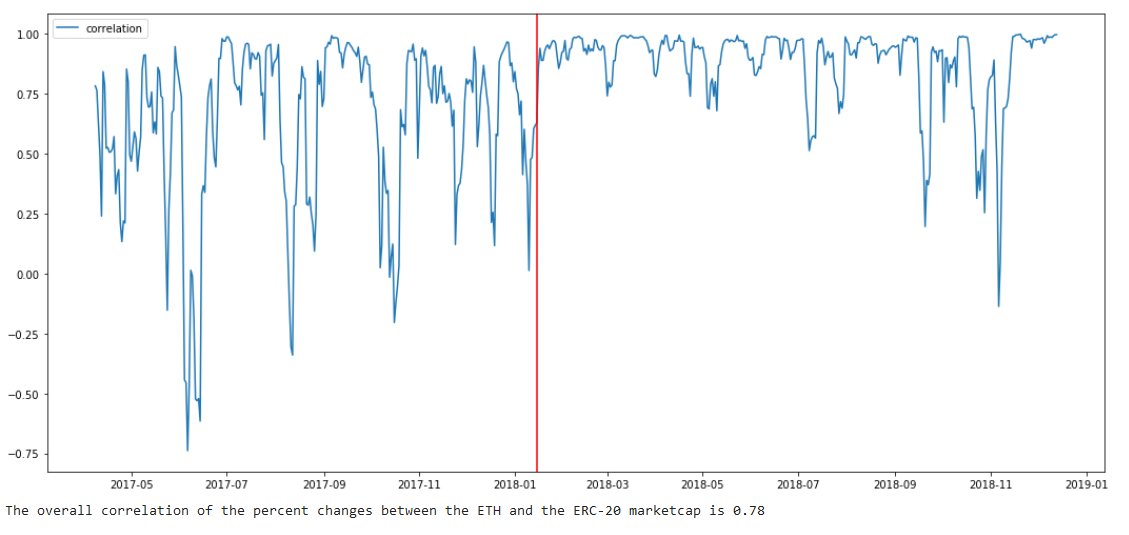
But, we can also spot some *extreme spikes* – especially during 2017 – where correlation drops clean to 0 or even turns negative.
This indicates that correlation btw ERC-20 and ETH market cap tends to be *lower in the bull market, and higher/more volatile in the bear market*
WHY is that?
In a typical bull run, everyone’s looking for that one project that will moon next. This leads to at least some amount of rsrch and value-based investing, causing *strong differences in the performance of some projects.*
As a result, there’s a *significant lack of project differentiation* during a standard bear market.
Link to that analysis - santiment.net/blog/is-divers…
Whether this trend continues given the current market turmoil remains to be seen.
(end)


