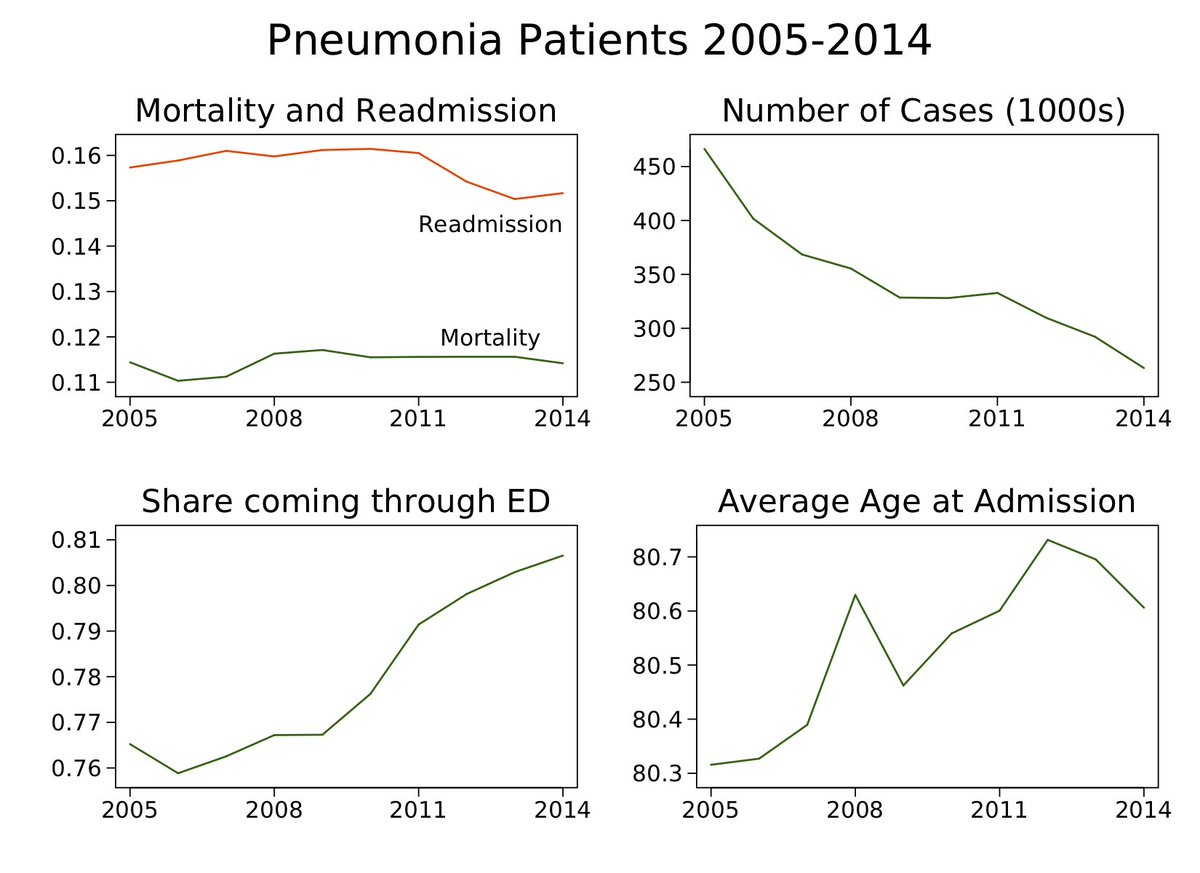
some thoughts & data inspired by the thought-provoking and carefully conducted @rkwadhera @rwyeh @kejoynt @Changyushen312 et al study on CMS hospital readmissions reduction program (HRRP). to get things started, here's some info on pneumonia index admissions in FFS medicare. 
@rkwadhera @rwyeh @kejoynt @Changyushen312 the question is: did HRRP cause an increase in mortality? while medical journals don't allow causal language outside RCTs, i'm talking about this research because i think it's informative about the causal effect! otherwise it's just 'association of 2012-2015 with mortality'
@rkwadhera @rwyeh @kejoynt @Changyushen312 to answer the causal Q, we need to know what would have happened to mortality absent HRRP: the counterfactual. while it's seriously helpful to establish one using a plausible comparison group — for HRRP, that's similar hospitals not subject to it — sometimes one doesn't exist.
Atul Gupta has very cool work using hospitals unlikely to face penalties as a kind of control group. see below thread for more info. note AG's approach identifies the HRRP incentive effect. tho as @johngraves9 noted, just being monitored could matter too
so to say time series research designs are not informative about causality suggests we'll never know the full effect of HRRP from quant research. surely such analyses are informative — see this excellent thread from @hmkyale reviewing them
@hmkyale at the same time, it's worth flagging limitations. here, i want to bring data to a couple concerns that could operate in ANY time series analysis.
1) is the counterfactual sensitive to how one models the trend?
2) are there signs that confounding factors are changing?
1) is the counterfactual sensitive to how one models the trend?
2) are there signs that confounding factors are changing?
@hmkyale the concerns are in no way specific to @rkwadhera et al's work. the authors explain limitations extensively in their paper and perform many robustness exercises. from eyeballing, our data looks similar. they were transparent and eager to engage with criticism (hence this thread!)
@hmkyale @rkwadhera to point 1 (trends), here's pneumonia mortality again. a stable series pre-HRRP might increase our confidence that a later deviation was due to HRRP. but the series is vacillating a lot around this time. in turn, it's harder to pin down out the counterfactual no-HRRP trend.
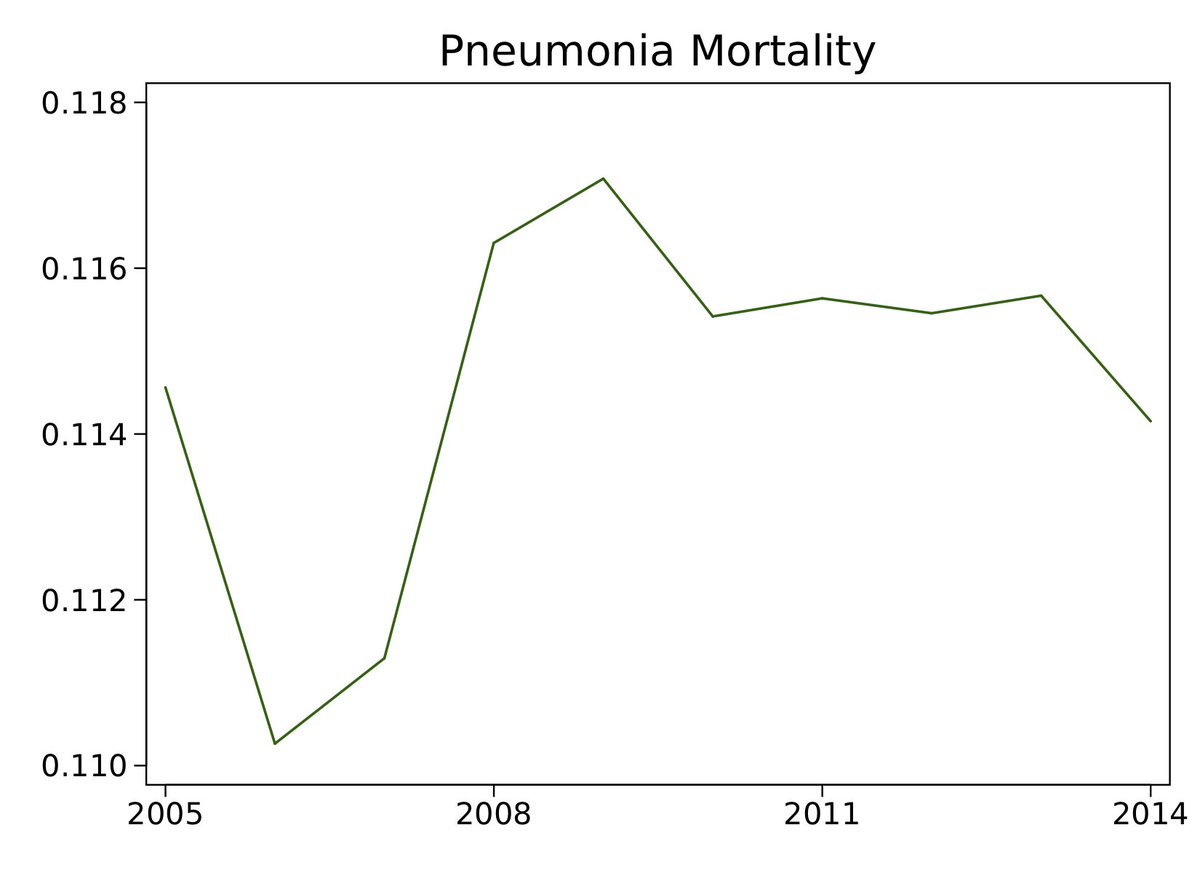
@hmkyale @rkwadhera the instability of the series means that results will be sensitive to the time period and shape used to estimate the trend. time series analysis is, effectively, less able detect deviations from trend: to be sure the deviation was due to HRRP, it would have to be big.
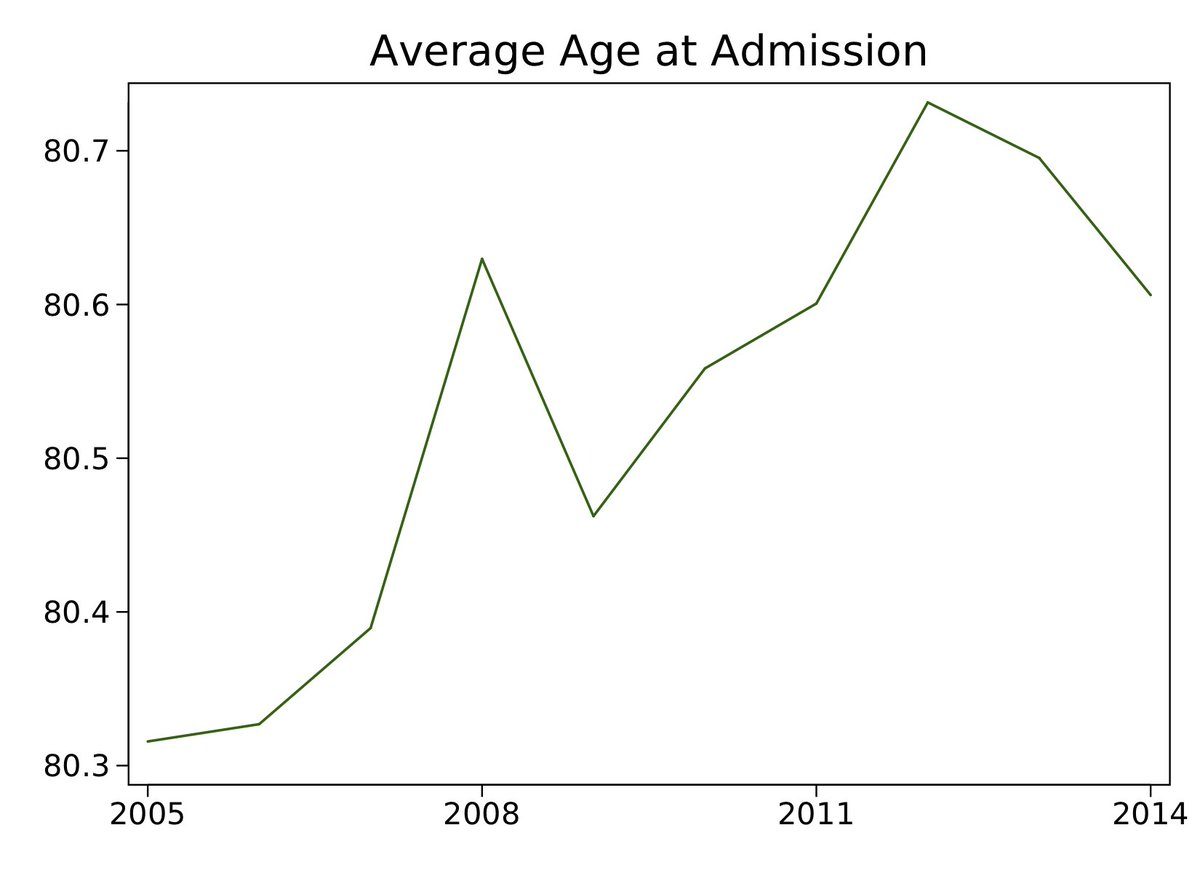
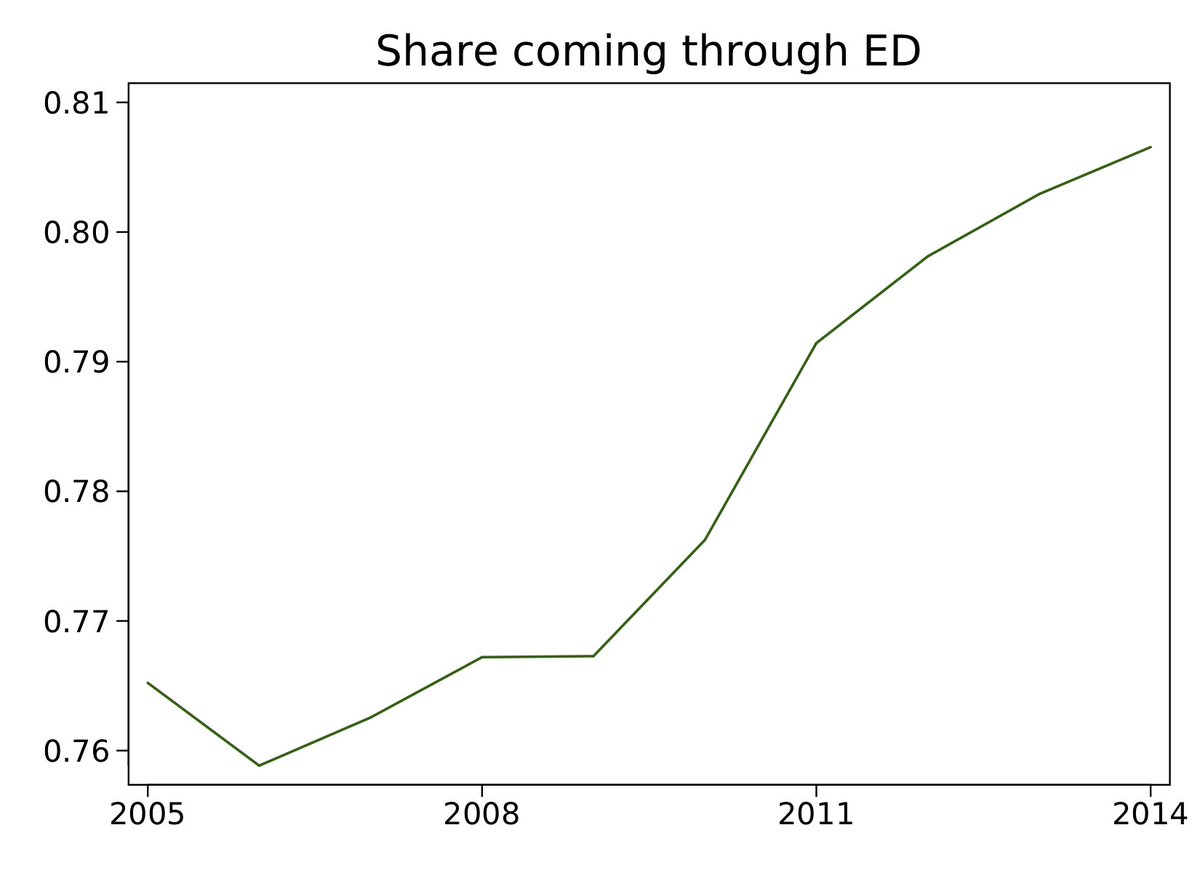
@hmkyale @rkwadhera to point 2 (confounding), to get a sense of whether results might be due to other factors associated with time (& HRRP implementation), it's helpful to look at observed correlates of patient outcomes. if they are stable, perhaps unobserved factors are too => confounding unlikely.
@hmkyale @rkwadhera here are 2 well observed, non-upcoded factors associated with outcomes: average age & the share of patients admitted thru the emergency dept. both rise meaningfully over this time. yes, we can control for these factors, but unobserved ones might be changing too, leading to bias.
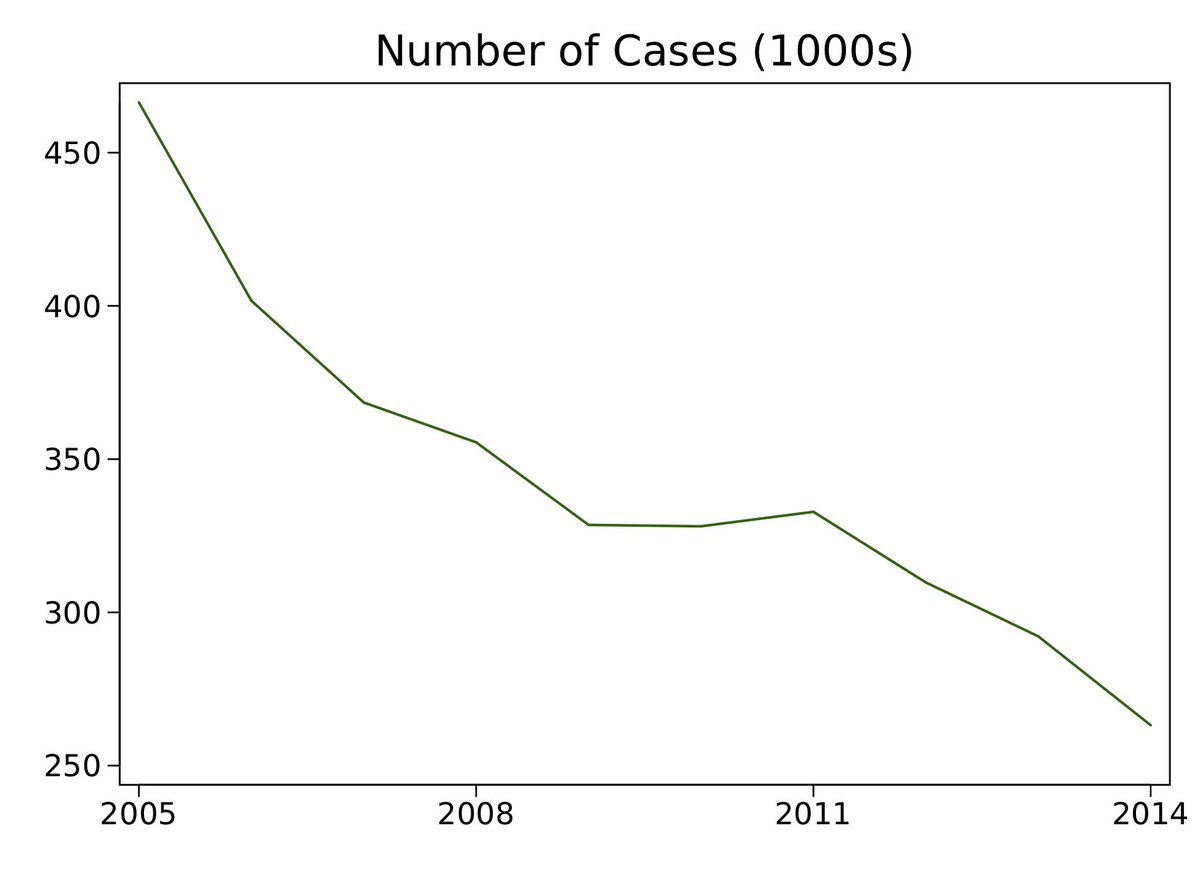
@hmkyale @rkwadhera here's another series that is informative about the potential for bias: the volume of pneumonia index admissions. patient volume drops over the period, suggesting that which pneumonia patients get admitted (& coded as such) is changing. MA penetration surely also plays a role.
@hmkyale @rkwadhera the best we can do in this case is to control for the factors we observe. here's a time series of 30-day pneumonia mortality adjusted for increasingly rich observed factors. green is raw, orange is age-race-sex, blue adds thru ED, red adds diagnoses from prior hospitalizations.
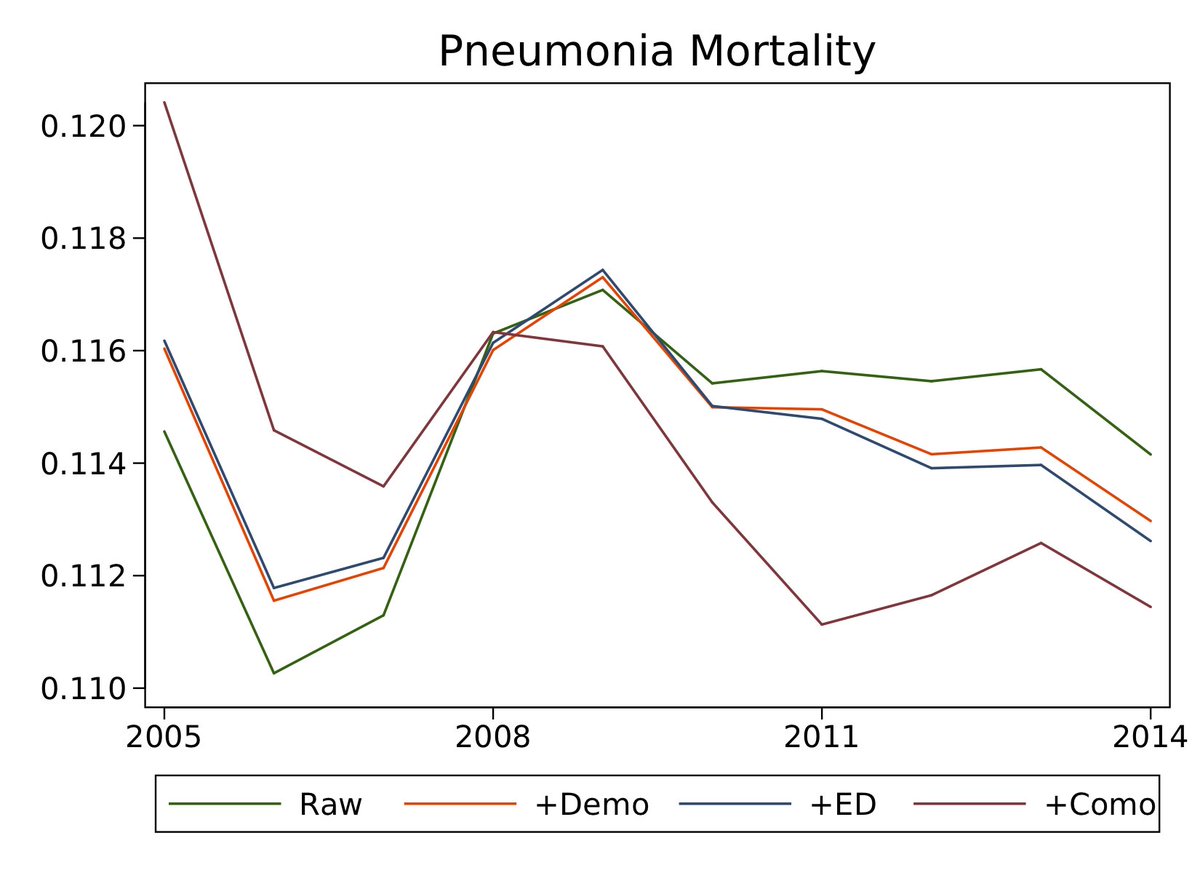
eyeballing the plot: adjusting for demographics & thru-ED admission makes recent trends look less suggestive of harm from HRRP, while adding prior diagnoses makes recent trends look worse. this sensitivity is a corollary of the movement in patient acuity measures over time.
summing up: time series analysis is clearly useful for figuring out causal effects of big programs including HRRP. for mortality effects, the instability of the series pre-HRRP & movement in potential confounders suggest a wide range of plausible estimates + concern about bias.
why are we here anyway? as Comprehensive Joint Replacement shows, payment reforms can be randomized to facilitate high quality evaluations and eliminate these confounding issues.
see @rkwadhera nejm.org/doi/full/10.10…
and Finkelstein & Taubman science.sciencemag.org/content/347/62…
see @rkwadhera nejm.org/doi/full/10.10…
and Finkelstein & Taubman science.sciencemag.org/content/347/62…
@rkwadhera one more thing: this data is derived from ongoing project w/ @amitabhchandra2 & all-star Harvard PhD student Pragya Kakani. construction is similar to Chandra et al. 2016 (dx.doi.org/10.1257/aer.20…)
* any faults of this analysis are my own!
* any faults of this analysis are my own!