,
10 tweets,
4 min read
Read on Twitter
1. Some observations based final US average estimate of the corn yield for 2018. First, 176.4 bpa represents the 5th straight year of above trend yields. Is this just good weather or a signal that rate of growth in trend yields has ticked up? 

2. What about 2019 trend yield for corn? LT trend below says trend yield is 171.6. Add 2 bu for weather bias that gets us up to 173.6. That seems a bit too low to me. I think something around 174-175 seems right to me. USDA will probably start about 176.

2. 2018 US corn yield was good but no bin buster relative to trend. +6.6 bpa above trend was only the 16th best since 1960. This makes sense to me compared to spring and summer weather, which ended up being decent but not stellar.

4. For those of you who like trend yield deviations in %. Even lower ranked this way

5. These are the years with truly monster yields relative to trend. Of the last 5 years, only 2014 ranks in the top 10. Sobering to think that some +10-15 bpa above trend corn yields are lurking out there. That would be 185-190 bpa national avg yield!

6. Top 10 years above trend with % deviations.

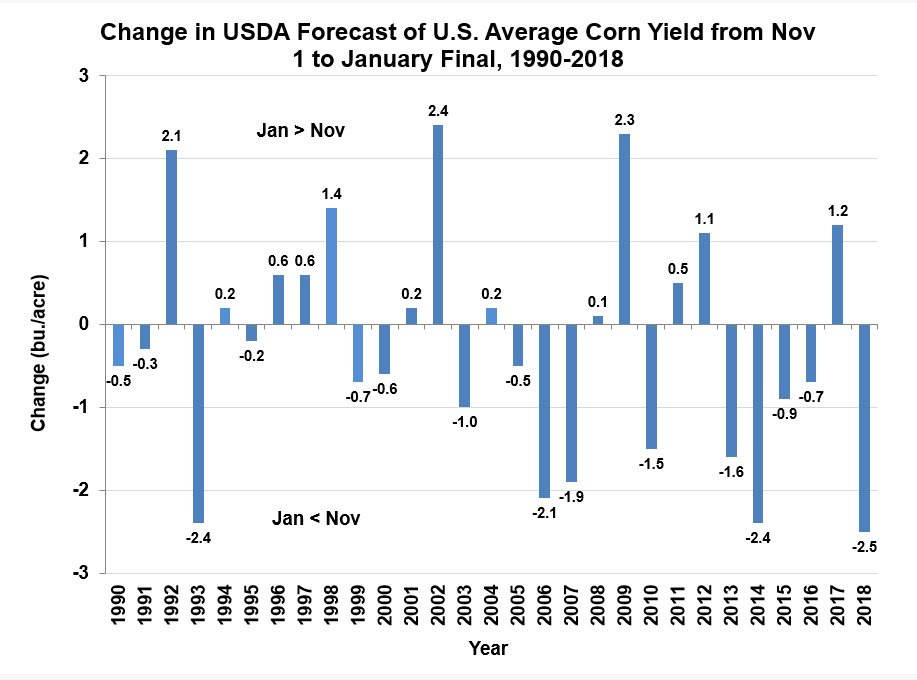
7. Now turning to USDA corn yield forecasts in 2018. Change from Nov to Jan this year was down 2.5 bpa, biggest drop over 1990-2018. Notice tendency of USDA to drop estimates in Jan in last few years.
8. Here is the pattern of USDA/NASS survey-based corn yield forecasts in 2018 relative to final. First forecast in Aug turned out to be pretty good. But why the sharp increase in September? Clearly led the market in the wrong direction. What happened?

9. Always important to remember that USDA forecast errors could just be due to random survey estimation errors. My question is whether the USDA/NASS started to place more weight on its satellite forecasts and this led them astray a bit. Satellite forecasts were optimistic.

10. In thinking about US corn trend yield I think this chart is very important. Notice that since 1996 we have basically had only 3 years with notable below trend yields (2002, 2011, 2012). That's only 3/23 yrs. Quite the before an after contrast. GMO traits or weather???