, 12 tweets, 3 min read Read on Twitter
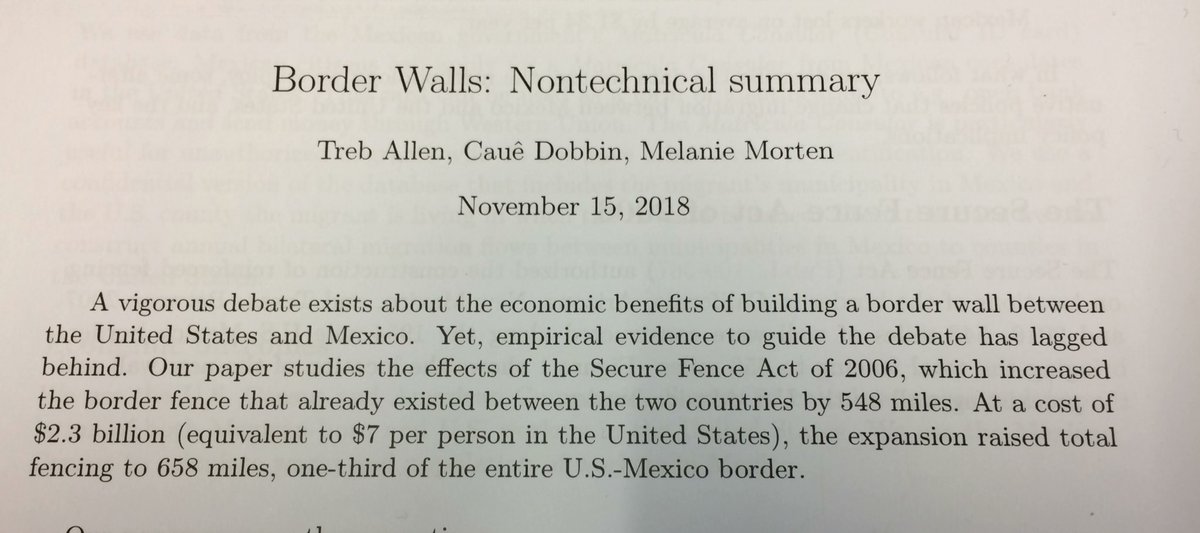
PACKED house in 597 Evans @berkeleyecon for Melanie Morten (Stanford) presentation on economic effects of 2006 construction of 658 miles of fence (wall) along US- Mexico border. Uses confidential Mexican micro data.
Findings. Migration falls but ... low skill workers gain a very small amount in wages, high income workers lose with lower wages, and — critically— the cost of construction per person exceeds any wage gains. Therefore net effect on US GDP: negative.
Same effect on migration but with positive effect on US GDP could be obtained through lowering trade costs between US and Mexico which would in turn increase wages in Mexico. And have a much more positive effect on wages in the US than the wall.
Note as FYI. $5.7 billion with ~160 million people in labor force is $35 per worker . Cost of construction from Secure Fence Act of 2006 was $7 per person.
Outcome variable for effect on migration draws from number of “consular matriculas” issued per year — a consular ID card issued to Mexican citizens living in the US. Fixed effects for origin-destination pair, origin-time, and destination-time.
In the period studied about 94% of border apprehensions were people of Mexican origin. So having dataset that restricts them to Mexican citizens isn’t 100% perfect but pretty darn good. Doing same study today with only Mexican data would be problematic because change in origins.
Result: about 13-14 percent decline in migration as a result of wall. Robust to inclusion of several confounding factors. But bigger question: economic effect. Wages? GDP?
Note that implicit in all of this: what’s the goal? Is measuring impact on wages or GDP the relevant question? Do we want to assess policy based on stated goals at the time? Or based on Econ usual fallback of wages and GDP? Short run? Long run? Lifetime? One year? Big questions.
Great map that showed for entire US by ?county? the impact on migration flows of construction of 2006 wall. Impact greatest on counties on a that-makes-sense path from Mexico that became blocked by wall. Not affected: Midwest states. Interesting to me because ... (next tweet)
Because I heard on NPR yesterday that current support for the 2019 wall construction is highest in upper Midwest states and lowest in current border states.
Overall: 👏👏👏. I really appreciate the authors serious empirical work. It deserves far more public notice. They are hesitant to extrapolate to an unknown future. But important results. @lilyjamali
Here's link to nontechnical summary stanford.edu/~memorten/ewEx… and to NBER working paper nber.org/papers/w25267. @melaniemorten lists media coverage already from The Economist; Quartz; Bloomberg; Politico
Missing some Tweet in this thread?
You can try to force a refresh.

Like this thread? Get email updates or save it to PDF!

Subscribe to Prof. Olney
Profile picture

Get real-time email alerts when new unrolls are available from this author!

This content may be removed anytime!

Twitter may remove this content at anytime, convert it as a PDF, save and print for later use!

Try unrolling a thread yourself!

how to unroll video

1) Follow Thread Reader App on Twitter so you can easily mention us!

2) Go to a Twitter thread (series of Tweets by the same owner) and mention us with a keyword "unroll" @threadreaderapp unroll

You can practice here first or read more on our help page!

Follow Us on Twitter!

Did Thread Reader help you today?

Support us! We are indie developers!


This site is made by just three indie developers on a laptop doing marketing, support and development! Read more about the story.

Become a Premium Member ($3.00/month or $30.00/year) and get exclusive features!

Become Premium

Too expensive? Make a small donation by buying us coffee ($5) or help with server cost ($10)

Donate via Paypal Become our Patreon

Thank you for your support!