,
24 tweets,
11 min read
Read on Twitter
Happy #OpenDataDay! During the last decade we have built numerous open data projects, from the OEC to DataUSA. Here is a thread with a historical summary of how this happened.
My first open data project was the now defunct Hudine (2008). Hudine visualized and distributed data on correlations among diseases extracted from millions of hospitalization records: . I did this with Nick Blumm at Northeastern.
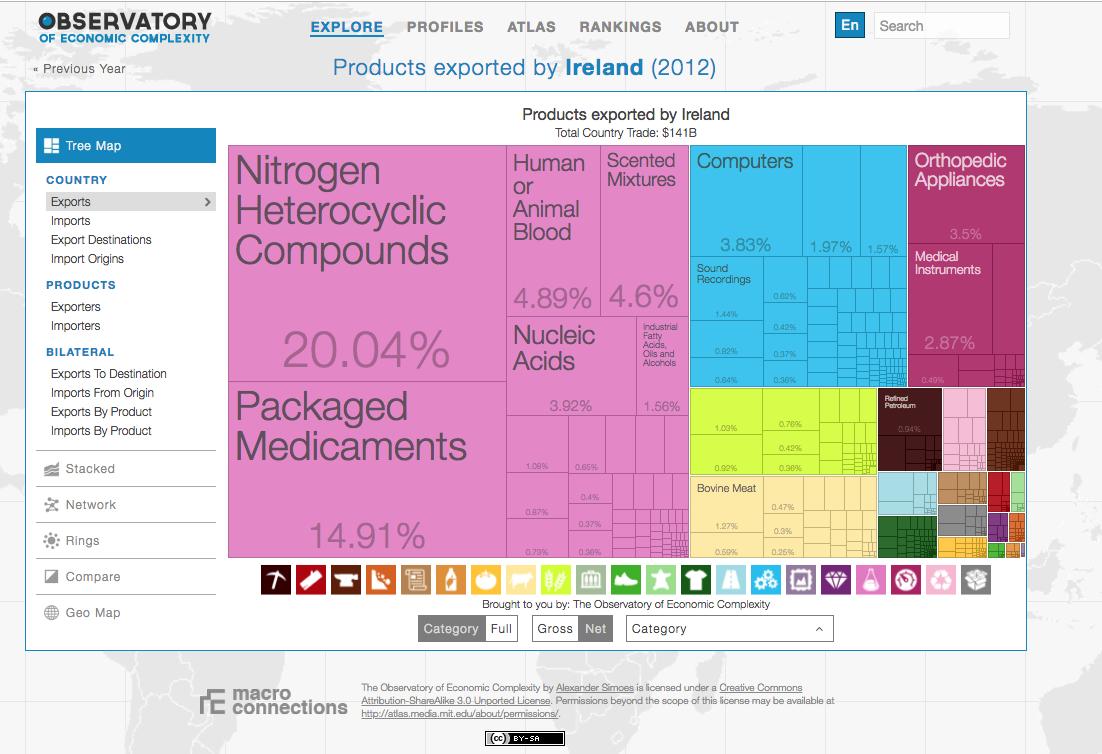
My second open data project was the Observatory of Economic Complexity or OEC (atlas.media.mit.edu) (2011), which distributes international trade data. vimeo.com/141271203?ref=…
The OEC has been widely successful. It has served over 100 million page views to over 20 million users. Its URL can also be found in over 2,500 Google Scholar documents. But what was more important about the OEC, is that it taught us a new design paradigm. 

The first versions of the OEC centered on the "VizBuilder." This is a page with dropdowns that help users select a visualizations from a universe of millions of visualization (here a screengrab from 2.0, which is still running at: atlaslegacy.media.mit.edu/en/explore/tre…)
The vizbuilder was powerful, but was bad for search engine optimization (SEO). Google's spiders don't click on dropdown menus and explore options. So we created a simple profile page to optimize for SEO.

In 2014, I realized that the vast majority of traffic was coming to the profile pages, not the vizbuilder, so that was the page we had to optimize. This lead to the 2015 redesign, which flips the site by making the profiles the main feature, and makes the vizbuilder secondary.


On the meantime, we started building DataViva in Brazil. DataViva was a much more ambitious project than the OEC because it included more sources of data (employment, trade, education), and much finer spatial and temporal resolution.
We released a first version of DataViva in 2013 and a second version in 2015. The original site is still available at: legacy.dataviva.info/en/
With DataViva we learned the painful lesson of how difficult it is for governments to maintain open data resources.
With DataViva we learned the painful lesson of how difficult it is for governments to maintain open data resources.
A change in the state government sent DataViva into limbo. The UI was unintentionally destroyed (dataviva.info/en/) and the project seemed lost. Yet, a few years later, we rediscovered that the project had enormous impact in Brazil.
The source code was pulled apart and segments of it resurfaced in official government websites. The trade parts of DataViva lives in Brazil's ministry of economy: mdic.gov.br/comercio-exter… other parts & inspiration also made it to Brazil's IBGE cidades.ibge.gov.br/brasil/mg/belo…
But in 2015, our gaze was on datausa.io. DataUSA provided an opportunity to apply the lessons learned in the OEC & DataViva. This time, we prioritized profiles fully and included non-economic data, such as data on housing, demographics, heritage, & health
DataUSA opened to big fanfare (2016), with an article in the New York Times (nytimes.com/2016/04/05/tec…) & a big press push. Yet, we knew that this traffic was not going to last forever. The profile based SEO was our strategy.
I was so confident that this strategy was going to work that I even wrote an article for Scientific American blogs.scientificamerican.com/guest-blog/wha… describing the design principles that we were using.
And as we expected, the referral traffic came and went, but over time, our SEO strategy paid off. Now DataUSA has a stable source of traffic & community, clocking at about 400k monthly users (and is appears in over 370 Google Scholar documents).

But DataUSA created new problems (which is a good thing). First, it created the problem of how to distribute datasets combining information from multiple public sources. Second, it created the problem of how to produce a site like DataUSA in months, instead of years.
To solve the first problem we created the DataUSA Cart, which we launched in 2017. The DataUSA cart allows users to merge the datasets they encounter while browsing the site. So they can quickly make a neatly organized table with columns from multiple public sources.
The second problem involved the creation of a series of new technologies at @datawheel. We moved our code base to a react based library we call canon: github.com/Datawheel/canon, we created a specialized CMS, & we also changed our APIs to OLAP cubes.
.@datawheel developed its new stack by creating dataafrica.io, datachile.io, pro.cnyvitals.org and codelife.com. The latter is a thirteen week free online course designed to teach the basics of web development (html, css, and javascript).
This new stack is now being applied to a complete rewrite of DataUSA (3.0), which will be launched in a few weeks. The new stack is also being used to complete a new version of pantheon.media.mit.edu which should also launch soon.
It has now been about 12 years since I started working in Hudine, a site built on a Perl/cgi-bin/flash/MySql stack. If you told me then that we would be here today, I would be surprised. We not only made progress, but set a foundation to keep on improving.
This progress was possible thanks to the wonderful team of people that grew around these projects. Alex Simoes (@ximoes ) joined my group as a student in 2010. He graduated in 2012 and started working in DataViva with me & @davelandry. They are now among my closest friends.
Soon after @jspeis joined us. He is now a partner at @datawheel and a close collaborator. Today, @datawheel employs 21 people in the United States, Chile, Brazil, & Colombia. The team is fantastic, and does everything from big data servers to AI.
We have also worked with wonderful clients and supporters for many years, such as @fapemig (DataViva & Codelife) & @Deloitte (DataUSA). All credits go to them. All mistakes, are my own. Happy #OpenDataDay everyone!!!