,
35 tweets,
11 min read
Read on Twitter
So UBER. Tough to make sense of it. Have seen people citing aggregated stats to get at unit economics but the US is 26% of trips and ~53% of revs, so aggregates not very helpful. There's some disclosures on adjusted platform revs and geos, but not enough to be useful. No cohorts.
Gonna start compiling some stuff here. But there are tons of assumptions I had to use. I think for the most part, as long as I'm within a reasonable margin of error, that being off on assumptions won't matter. But do take everything with a grain of salt. And please correct me.
this is busy af. Bookings looks fine, ridesharing slowing and Eats still growing well, but in 2H 18, Adjusted Revs changed dramatically. Adjusted Take rates plummeted as driver incentives soared, plus other changes must have happened as well. 

The problem with looking at in aggregate is that these are different businesses. In Q4, the adjusted take rates were 20.2% and 6.4% for Ridesharing vs Eats.
Uber is a massive international business as well. You can see the breakout of major regions. This is on revenue, not adjusted. The US is big, but still only 54% of revs. Remember, the US is only 26% of trips in Q4.

Using that data, I separate out US vs International on a per trip basis. This is for 2018. Many assumptions... You can see Bookings / Trip are $20.35 in the US vs $5.75 Internationally. Revs / trip ~ $4.50 vs $1.35. Adjusted Revs / Trip $4.10 vs $1.15.

Zooming in on Q4 18, can see relative stability in Bookings / trip, but noticeable decline in Revs/Trip and particularly in Adjusted Revs/Trip. For the US, it looks like Adjusted Revs / Trip fell from $4.10 for the full year to $3.50. Again, allow for some margin of error.

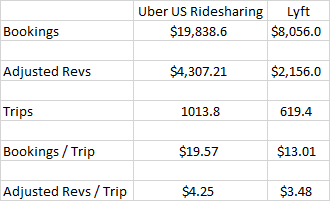
To compare Lyft and Uber, you should use Uber US. Here's 2018. Uber does 3x+ more Bookings on 2x+ more Rides. People citing Uber as earning less per ride than Lyft are using aggregates. On a like for like Uber appears to exceed Lyft on Bookings, Revs, and Adjusted Revs per Ride.

Q4 18 appears to be a different story. Bookings and trips are roughly the same ratio, but because I assume Eats is a big US biz, and because both Ridesharing and Eats saw large declines in Adjusted take rates, it appears Uber Adjusted revs / trip fell below Lyft in the US in Q4.

This is not entirely fair though. Revs per trip still appears to exceed Lyft. Adjusted Revs at Uber is deducting Excess Drivers Incentives, which is in S&M, so is not directly comparable to Lyft.

Also interesting to compare the growth drivers of Uber and Lyft. Here have to use Uber aggregates b/c not enough info. Rider and Booking growth are relatively similar, especially given how much bigger Uber is than Lyft. But Lyft's revs are soaring b/c their take rate is soaring.

It would be great to be able to look at Uber's unit economics in US vs International and then compare to Lyft as well. But not gonna happen. Would love to know if people have better ways of getting at it.
Anyway, the TL,DR is ¯\_(ツ)_/¯. Uber was basically a public company in the private markets. Now it's gonna be a public company investing like a private one to grow Eats and Freight and Autonomy and whatever else comes along, while trying to scale Ridesharing to profitability.
On opex leverage, it was interesting that the only expense line item Uber specifically called out as expecting to decline as % of revenue over time was Operations and Support, while the only one Lyft called out was Sales & Marketing. Interesting since both have negative margins.
This is a good point. If you assume 65%-70% of Eats is US based, and you use $30 Bookings per Eats order, still gets you $18-$19 in Bookings / Ride for Uber US Ridesharing vs $13.08 for Lyft in Q4 2018.
Again, a ton of assumptions involved here, if you change the total US Gross Bookings number then these numbers move a bit, but in general looks like Uber US Ridesharing Bookings / Ride is $18-$19.

thx for feedback, gonna make some edits based on a disclosure I missed and trying to divide out Eats from Ridesharing in the US to get a better comparison to Lyft
This is a second cut at US vs International for FY 18. Brought US Bookings down. Backed Other Bets out of Revs.

For Q4 18, they give you US trips and international Gross Bookings, so I feel good about the Bookings / Trips split here. Revenues less so.

Here is Uber US vs Lyft, and Uber US Ridesharing vs Lyft, for FY 2018. I assume an UberEats average order of $15. Every dollar up/down is worth $.50 in Bookings / Ride in Uber US Ridesharing.

Here is Uber US vs Lyft, and Uber US Ridersharing vs Lyft for Q4 18. Again assuming UberEats Bookings of $15. Can see the deterioration in the per trip numbers, though US Ridesharing still healthily ahead in Bookings / Trip, but with a meaningful decline in Adjusted Revs/Trip.


this is a work in progress, b/c there's so many moving pieces. feel free to add to it.
So @pommelhorse9 points out using credit card data, you can infer UberEats US bookings by comparing to GRUB GFS. Puts the US at closer to 35% of UberEats. That flows through in a number of ways because it also means I was over allocating Excess Driver Incentives to the US.
Here is an updated Q4 US vs International breakdown after moving a greater percentage of Eats bookings into International.

Here is an attempt to breakout Uber US in terms of Ridesharing vs Eats. Again, tons of assumptions here, but trying to get closer to reality each time.

Here is updated Uber US Ridesharing vs Lyft in Q4. Many have noted that Uber counts tolls etc in Bookings and Lyft doesn't, but I have no way to adjust for that.

As Gavin points out, it is almost certain that Uber's per ride economics in the US are more favorable than Lyft's, given scale, and the fact that in 1H 18, Uber showed meaningful contribution profit.
Here was Lyft's per ride economics. They have never reported a contribution profit, so it's fair to assume Uber's per ride economics in Ridesharing look meaningfully better than this in the US. But no way of proving that.
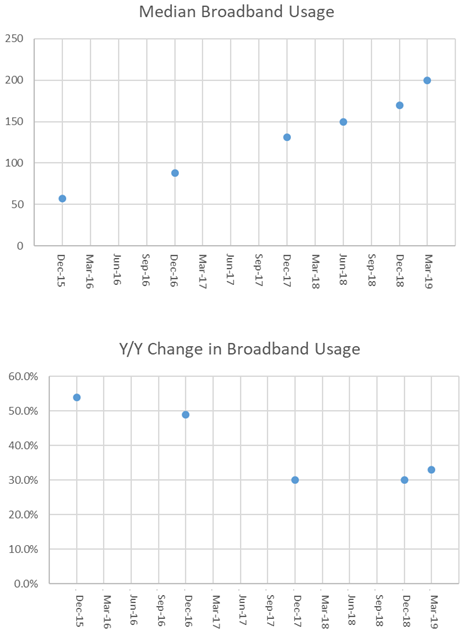
Uber updated Q1 19. Headlines don't say much: riders and trips relatively constant growth, bookings slowing. Biggest thing that jumps out is Platform Adjusted Revs growing 9% in Ridesharing.

When you look at Uber Ridesharing, Bookings have only gradually decelerated to low 20s growth. But Revenue and Adjusted Revenue are now growing high single digits. It's about take rate falling modestly but steadily.

Uber Eats is a different story. Bookings and Revenue continue to grow quickly, but Adjusted Revenue growth has plummeted as Excess Drivers Incentives as a % of Bookings have soared, likely from opening new cities. The potential good news is Take Rate pre-incentives is 17.3%.

On Excess Drivers Incentives, they added an example for Uber Eats. It's interesting that they chose $18 as the Basket Value. Not sure if meaningful, but the $10 Bookings they use for Ridesharing corresponds to average Bookings/Ride of "under $9".

This "one time" disclosure of Contribution Margin by country is a tease. In their top 5 countries - US, UK, Brazil, France (?), ??? - Contribution Margin ranges from -10% to 54%. So one of Uber's top 5 countries has over 50% contribution margins. Helpful!

And finally the new regs in NYC caused Uber to gain share but business to decline.

So the Ridesharing biz is growing HSD, and it's mostly because of lower take rates, not Bookings. Eats has higher take rates than appeared, and Adjusted Revs are likely depressed by new cities. One of their cities is very profitable. Other than that, it's still ¯\_(ツ)_/¯.