Coca-Cola has been in a strong #uptrend since March 2009, the high of $44.47 (March 1998) was finally overcome in October 2014 recording a new all time high of $44.87. Since 2019 the uptrend has been fortified. .......
2/7
2/7
.... Buying and holding for the short and long term will workout well and holding this stock pays a good #dividends. Only a close below $33.00 would turn the trend bearish.
3/7
3/7

Chart 2
Monthly Chart: Current Fib resistances are visible. A strong close above 55.22 is required to target new all time highs. Support is very formidable - all the way to $35.00.
5/7
Monthly Chart: Current Fib resistances are visible. A strong close above 55.22 is required to target new all time highs. Support is very formidable - all the way to $35.00.
5/7

Chart 3
Weekly Chart: Natural pivots (in black) act as demand points. Minor #support (the blue square) and 51.00 further down below.
6/7
Weekly Chart: Natural pivots (in black) act as demand points. Minor #support (the blue square) and 51.00 further down below.
6/7
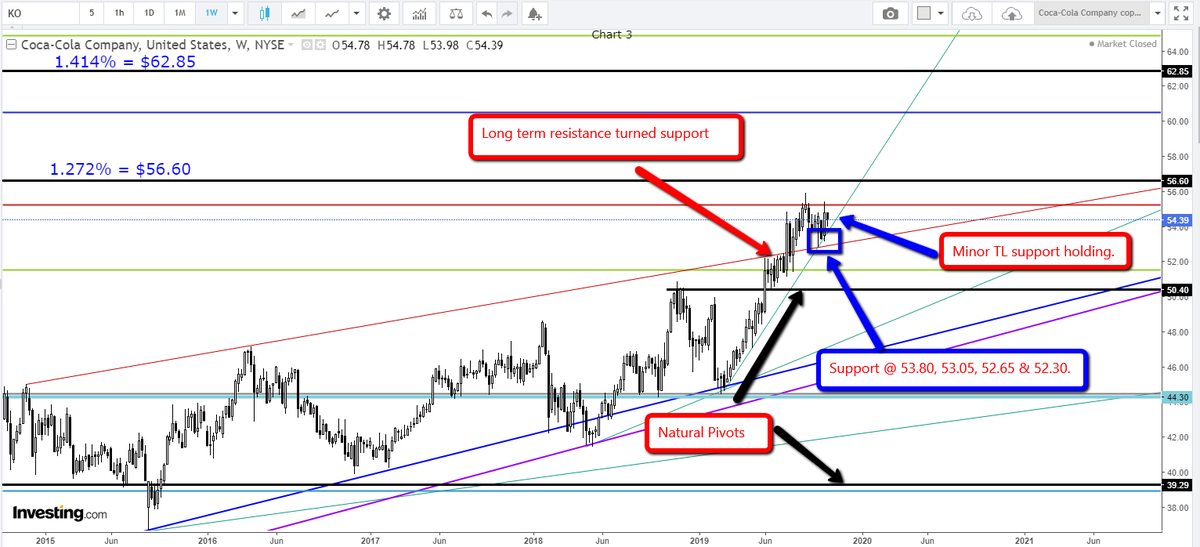
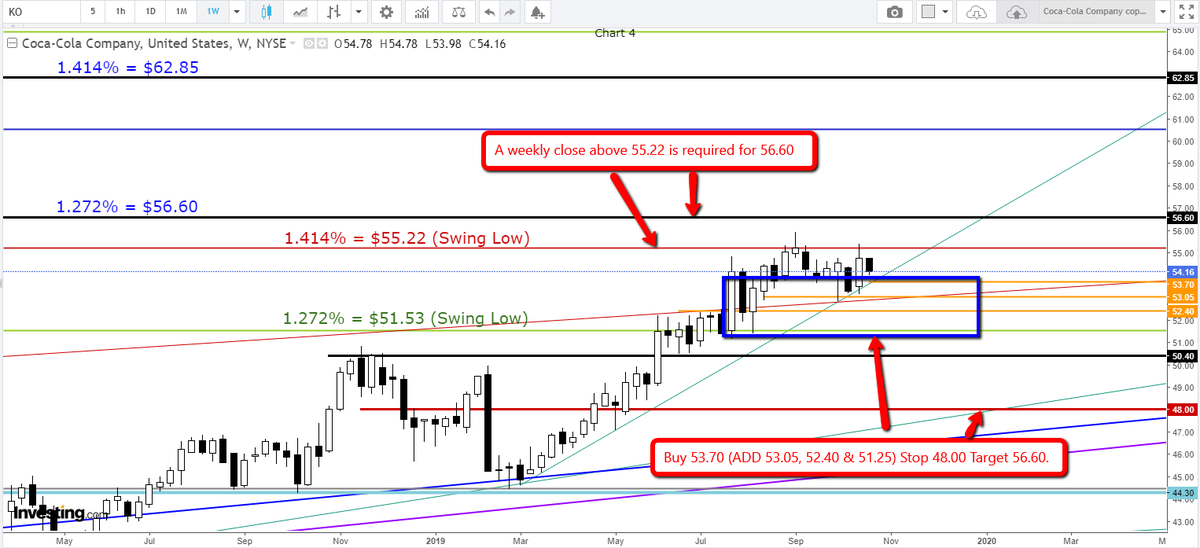
Chart 4
Weekly Chart: As I said above I would only attempt longs for this stock. The #strategy has been presented in the image.
7/7
Weekly Chart: As I said above I would only attempt longs for this stock. The #strategy has been presented in the image.
7/7