
I want to spend some time on this, because it's a perennial source of friction. Groups like @MalariaAtlas and @IHME_UW that produce annual time series of disease metrics spend a lot of time trying to work through the "why does the past change" criticism.
@MalariaAtlas @IHME_UW Punchline: I believe that the solution is to change communication conventions such that the uncertain nature of modeled results is front and center, all the time.
@MalariaAtlas @IHME_UW Reporting only mean values is definitely misleading. But even the "Mean (Lower CI- Upper CI)" format minimizes the fact that these estimates are more accurately described by ranges than by single points.
@MalariaAtlas @IHME_UW Consider three sentences:
1. We estimate X cases in 2018.
2. We estimate X cases (95% CI A-B) in 2018.
3. We estimate between A and B cases in 2018, with 95% confidence.
Only #3 highlights the most relevant values, while making clear that we *do not actually know* the case count.
1. We estimate X cases in 2018.
2. We estimate X cases (95% CI A-B) in 2018.
3. We estimate between A and B cases in 2018, with 95% confidence.
Only #3 highlights the most relevant values, while making clear that we *do not actually know* the case count.
@MalariaAtlas @IHME_UW I know this feels strange and clunky, but we encounter this type of language all the time. When was the last time you saw a weather prediction for exactly 5mm of rain? My guess is never, because climate modeling has embedded uncertainty into its language at every level.
@MalariaAtlas @IHME_UW So why should health modeling, which has *dramatically worse* data collection than climate modeling, pretend to be *more certain* about its outcomes?
@MalariaAtlas @IHME_UW I think that modelers, model communicators, and policymakers alike need to make a concerted collaborative push to change the way we talk about model outputs, that will also improve the way we interpret and act on modeled results.
@MalariaAtlas @IHME_UW Ok, I'll get off my soapbox now to say a few words about @ricprice99's main point: why the heck does the whole time series change so much year on year?
@MalariaAtlas @IHME_UW @ricprice99 Note: I did not work on the WMR estimates, so can't speak to them directly. I'm speaking generally about reasons one *might* see changes in modeled time series results.
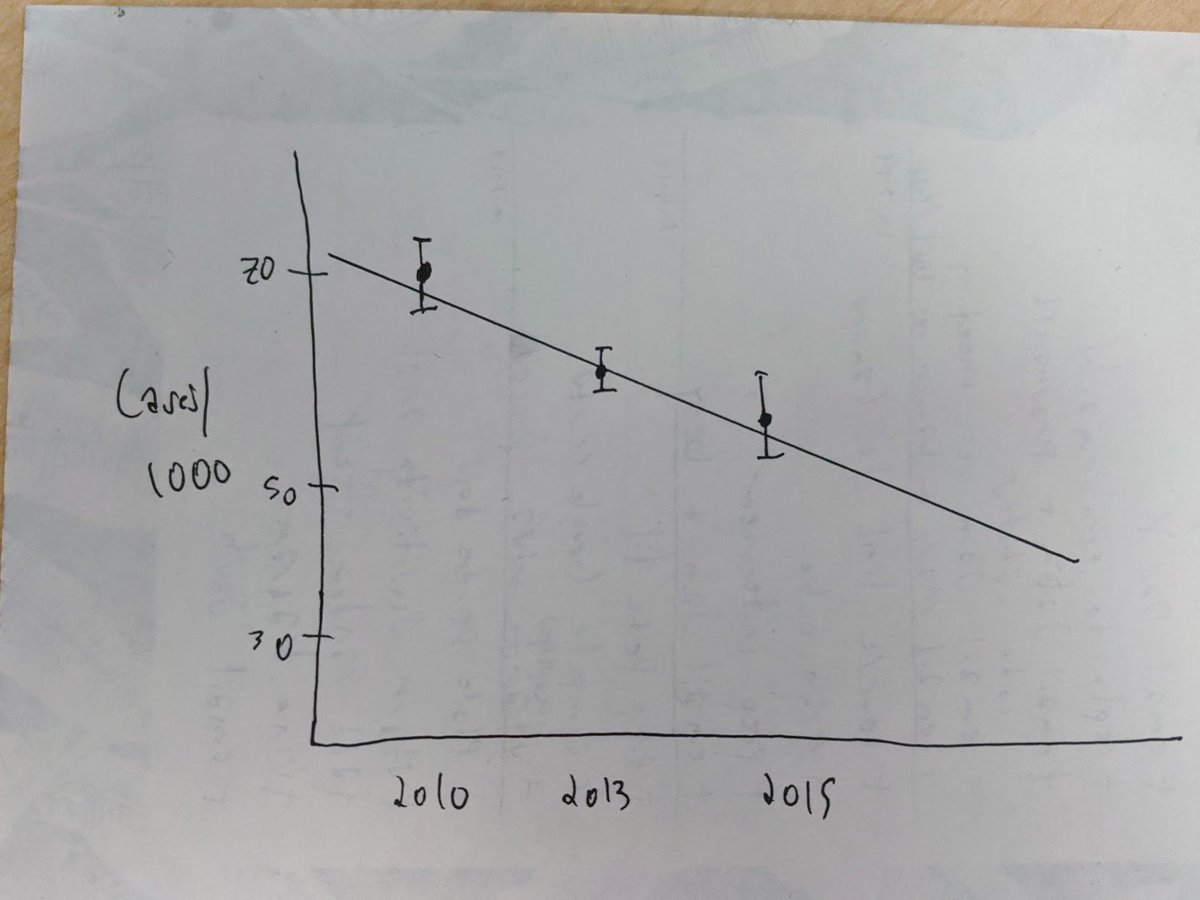
@MalariaAtlas @IHME_UW @ricprice99 First point: Small changes in rate space lead to big changes in count space. Illustrative example: Say you're working on WMR 2016, and this is your data. You run an analysis and get an incidence time series as represented by the line. 
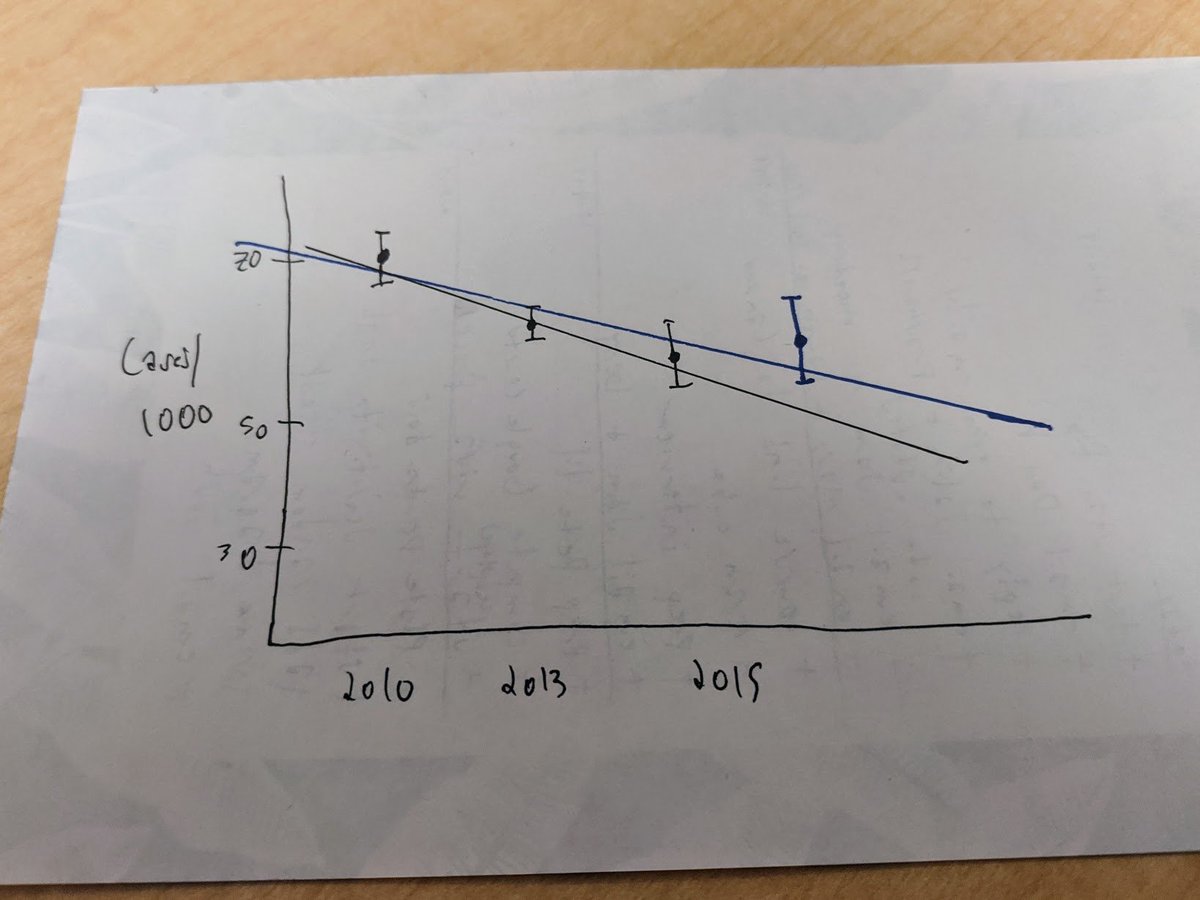
@MalariaAtlas @IHME_UW @ricprice99 Then, two years later, you run the same analysis, now with an extra time point. The slope of the line isn't that different, and your new time series falls well within the confidence interval of your old one.
@MalariaAtlas @IHME_UW @ricprice99 However, when you're working with population denominators as big as the ones we see in malaria, when you convert to case counts, your new estimates will show *millions of extra cases* for past years compared to your previous estimates!
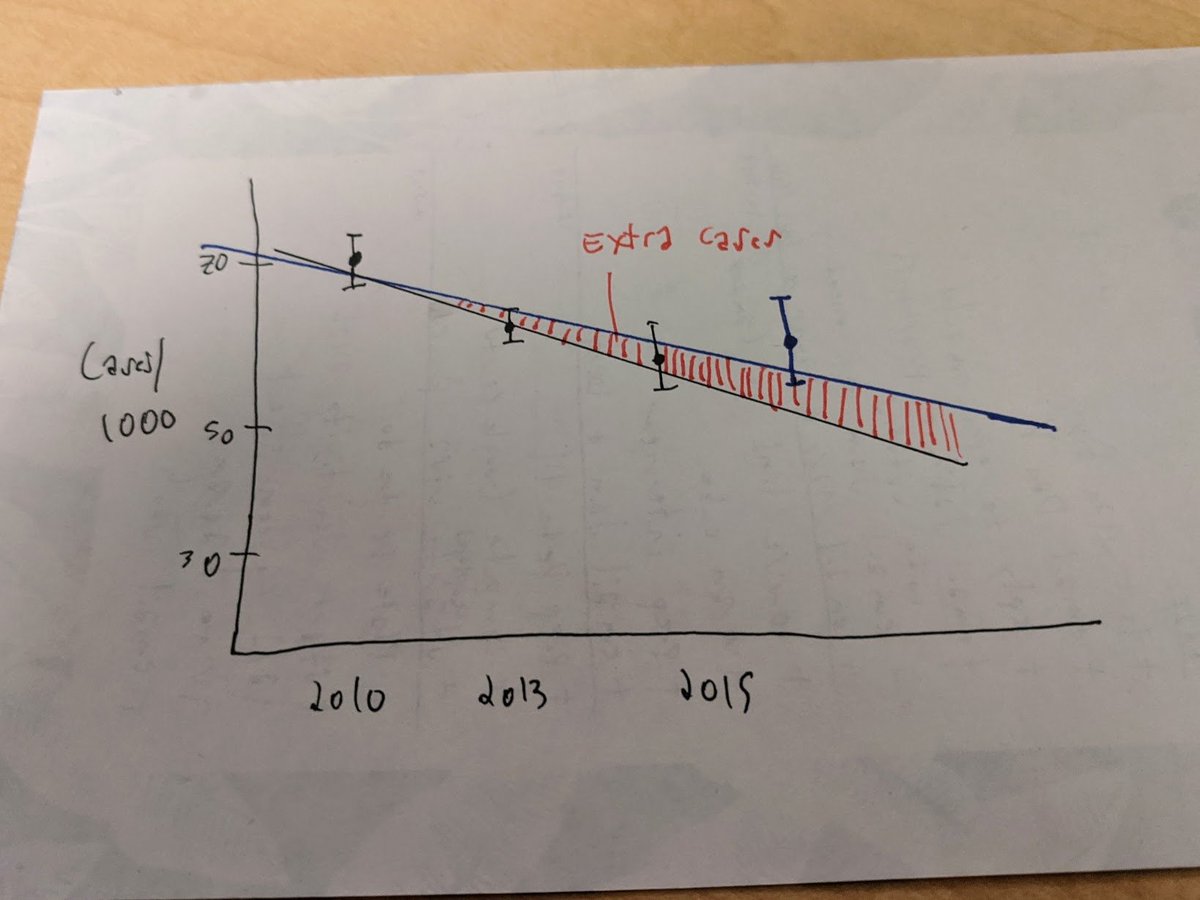
@MalariaAtlas @IHME_UW @ricprice99 (Burden estimation for malaria is of course much more complicated than "drawing a straight line through data", but the basic idea translates.)
@MalariaAtlas @IHME_UW @ricprice99 Second point: Modeling strategies for burden estimation are constantly changing. Population denominators get updated. We get improved covariates. We implement more accurate estimation methods. We find bugs. These are good changes, but they cause trouble.
@MalariaAtlas @IHME_UW @ricprice99 We want to make our results as accurate as we possibly can, but we understand that "better" estimates are not always welcome when billion-dollar policy decisions have just been made off of the old estimates.
@MalariaAtlas @IHME_UW @ricprice99 This isn't a problem with an easy or one-sided solution. It mandates a closer relationship between modelers and stakeholders, and (again) a fundamental shift in the language we use to communicate and act on these estimates.
@MalariaAtlas @IHME_UW @ricprice99 The good news: these types of deep relationships are becoming more common and more expected, most prominently in the HBHI strategy now underway. I'd highlight @SwissTPH and @MORUBKK as groups that have been modeling this good behavior for many years already.
@MalariaAtlas @IHME_UW @ricprice99 @SwissTPH @MORUBKK I'm also seeing a lot of energy towards efforts to move modeling and data science for malaria into the hands of researchers from endemic countries, where it belongs. For much more detail on that, follow @Fredros_Inc and friends.
@MalariaAtlas @IHME_UW @ricprice99 @SwissTPH @MORUBKK @Fredros_Inc UPDATE: Wow, just saw this really misleading plot from a FT article that calls for a "no-holds-barred inquiry" into these deviations
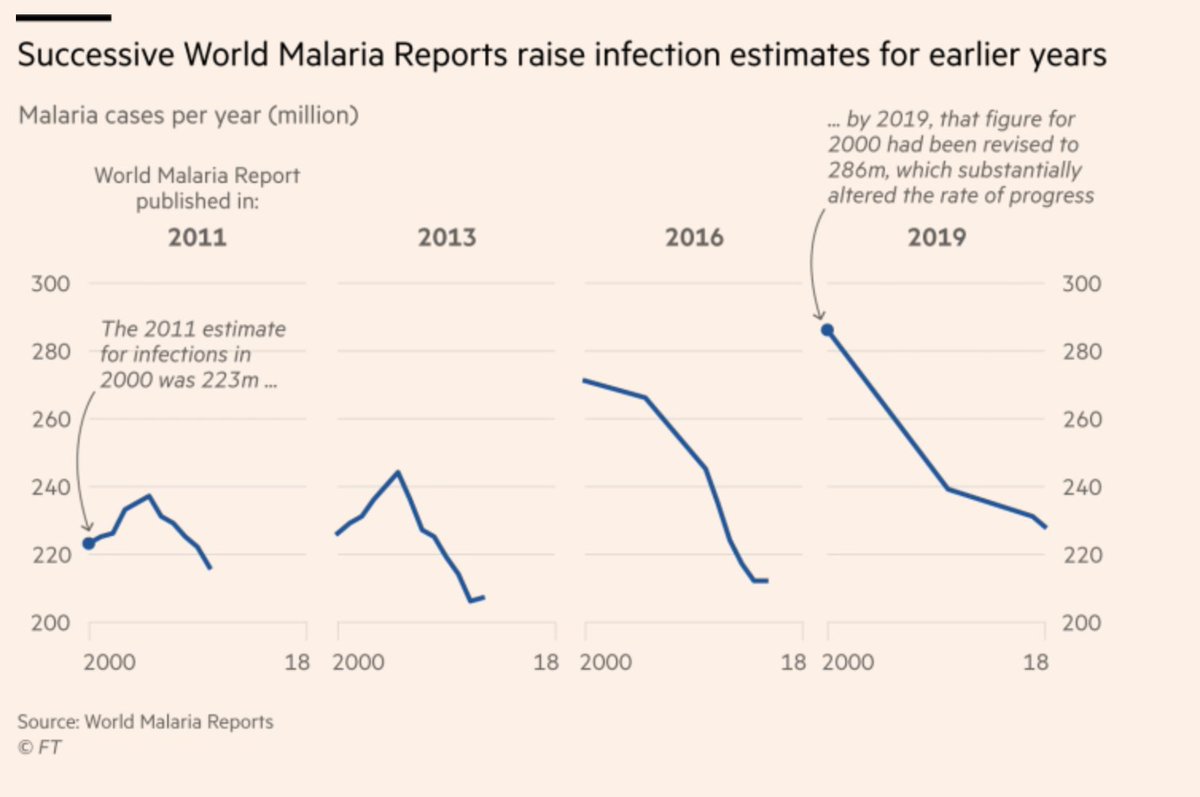
@MalariaAtlas @IHME_UW @ricprice99 @SwissTPH @MORUBKK @Fredros_Inc I took the liberty of making a plot of my own from those same reports, but including the CI's that are listed in the report right next to the mean counts:
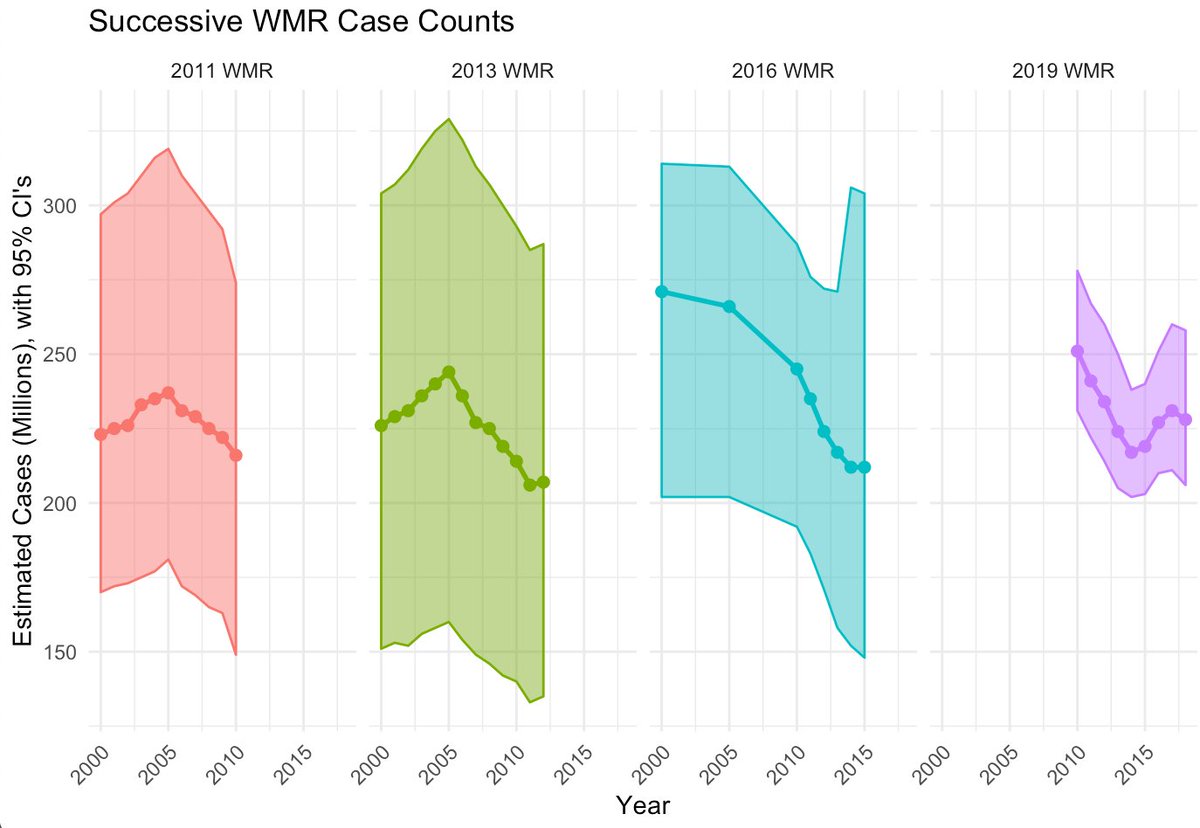
@MalariaAtlas @IHME_UW @ricprice99 @SwissTPH @MORUBKK @Fredros_Inc (Couldn't find the data point for 2000 in the FT article, full link is here on.ft.com/33Z9GzJ). Even preserving a truncated y-axis and using x-axes to exaggerate the time series effect, the second plot clearly shows that the new estimates are well within what we'd expect.
@MalariaAtlas @IHME_UW @ricprice99 @SwissTPH @MORUBKK @Fredros_Inc I want to be clear here that it is good and proper for people to question modeled results, and our job as modelers to make our work comprehensible. We too have failed if you can't interpret the uncertainty we report.
@MalariaAtlas @IHME_UW @ricprice99 @SwissTPH @MORUBKK @Fredros_Inc But the article borders on accusing WHO of malpractice, which feels unreasonable given that the reports *do* clearly list CI's. Whoever collated the data for the plot they published had to scroll right past the "Lower" and "Upper" reported values in the tables.
As @Fredros_Inc and others have noted, the best part of the FT article is @NoorAbdisalan redirecting our attention where it belongs: towards improving surveillance systems so we can gain a true understanding of how to save lives.


